
Image
|
Figure Caption
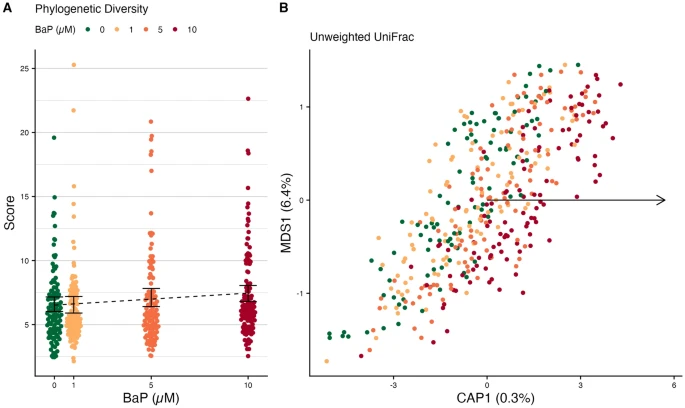
Fig. 3 Differences in larval microbiome diversity and composition by BaP exposure. (A) Phylogenetic diversity of larval microbiomes. Black error bars represent bootstrapped 95% C.I.s around the means; the dotted black line represents the estimated trend line from regression. (B) Unweighted UniFrac beta-diversity dbRDA ordination of larval microbiomes. Points are colored by BaP exposure. The black arrow indicates the direction of the trend in BaP exposure in ordination space. Percentages in the axis labels indicate the percent variance in microbiome composition explained by each axis.
Acknowledgments
This image is the copyrighted work of the attributed author or publisher, and
ZFIN has permission only to display this image to its users.
Additional permissions should be obtained from the applicable author or publisher of the image.
Full text @ Sci. Rep.