
|
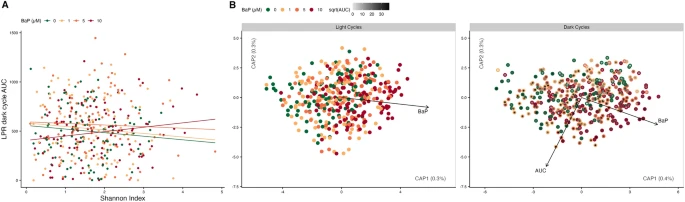
Fig. 4 BaP effect on microbiome diversity metrics and behavior. (A) Scatter plot of alpha-diversity scores (Shannon index) on the x-axis and LPR dark cycle AUCs (larval activity) on the y-axis. Lines indicate relationships estimated from mixed-effects linear regression models, the interaction between Shannon scores and BaP exposure is significant (p = 0.038). Points and lines are colored by BaP exposure. (B) Distance-based redundancy analysis (dbRDA) ordination of unweighted UniFrac scores comparing microbiome composition between samples. Each point represents a sample, the closer the samples, the more alike their microbiome composition is according to the distance metric. Black arrows indicate the direction of greatest change in the indicated covariates. Only statistically significant relationships are shown. In the left panel, ‘light cycles’, points are colored by BaP exposure. In the right panel, ‘dark cycles’, the outer edges of the points are colored by BaP exposure while the center of the points are colored by the square-root (for visualization purposes) of the LPR AUC for each sample.