
Image
|
Figure Caption
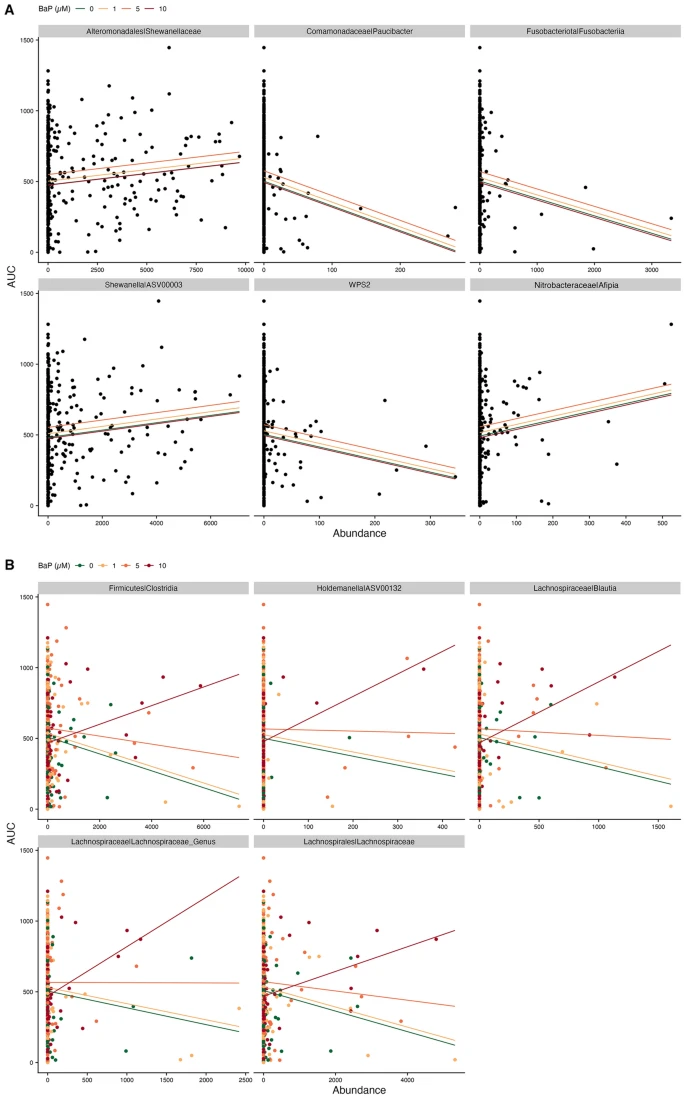
Fig. 5 Scatter plots of taxon abundance by LPR dark cycle AUCs. (A) Examples of taxa with significant main effects, i.e., the predicted relationship is the same for all BaP exposures. (B) Examples of taxa with significant interactions, i.e., the predicted relationship is different for different levels of BaP exposure. For both panels, significance indicates p < 0.05., and lines indicate estimated regression relationships from models, colored by BaP exposure.
Acknowledgments
This image is the copyrighted work of the attributed author or publisher, and
ZFIN has permission only to display this image to its users.
Additional permissions should be obtained from the applicable author or publisher of the image.
Full text @ Sci. Rep.