
|
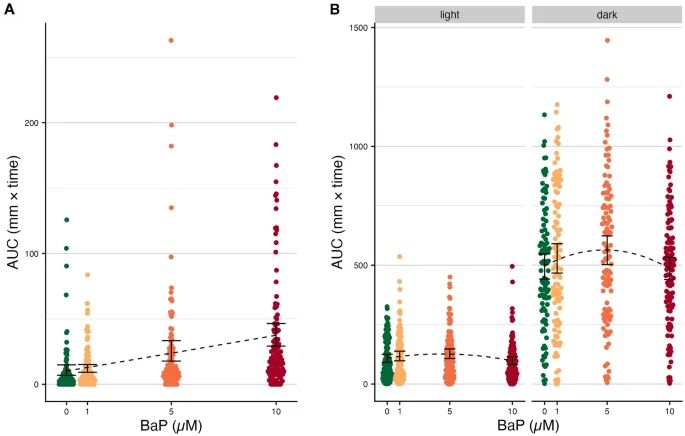
Fig. 2 Behavior assay results (A) Embryonic photomotor response (EPR) movement data (n = 573). Areas under the curve (AUCs) for the movement curves from panel A, measured only in the window between the dotted lines. Black error bars indicate the 95% C.I.s for the mean AUC per BaP exposure level. The black dotted line indicates the estimated association from linear regression. (B) Larval photomotor response (LPR) movement data (n = 573). AUCs for the movement curves from panel A, split by cycle (light versus dark). Black error bars indicate the 95% C.I.s for the mean AUC per BaP exposure level. The black dotted line indicates the estimated association from polynomial linear regression.