
- Title
-
Piezo1 mutant zebrafish as a model of idiopathic scoliosis
- Authors
- Ramli, ., Aramaki, T., Watanabe, M., Kondo, S.
- Source
- Full text @ Front Genet
|
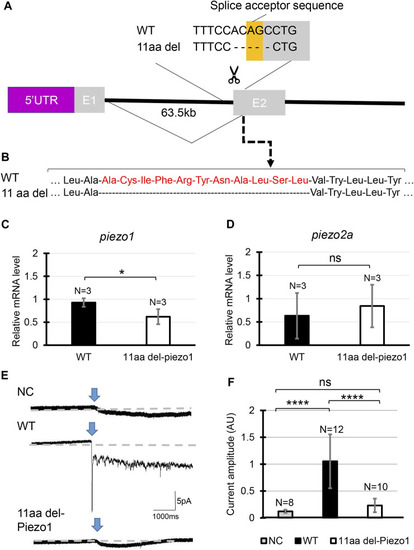
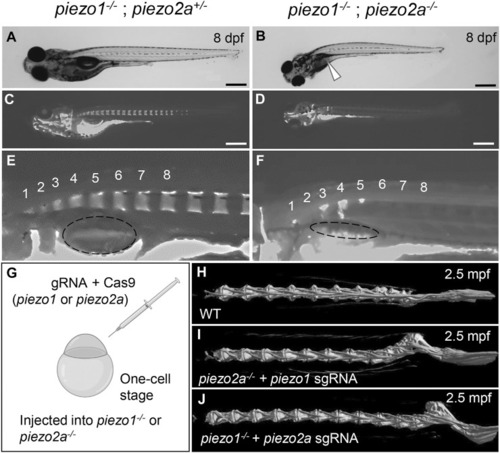
Generating |
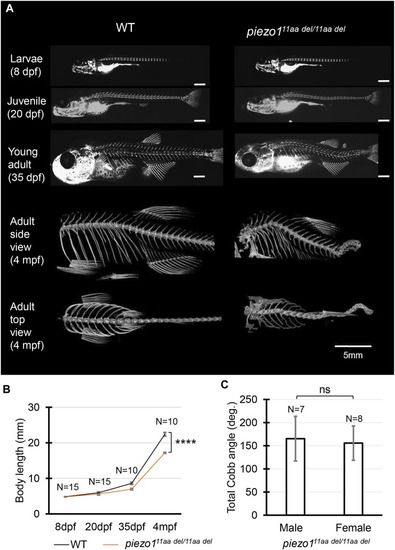
Phenotype of PHENOTYPE:
|
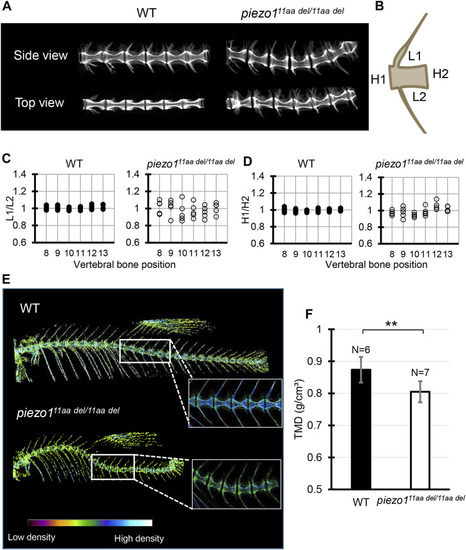
Detailed analysis of vertebra shape. PHENOTYPE:
|

Abnormal osteoblast function. EXPRESSION / LABELING:
PHENOTYPE:
|
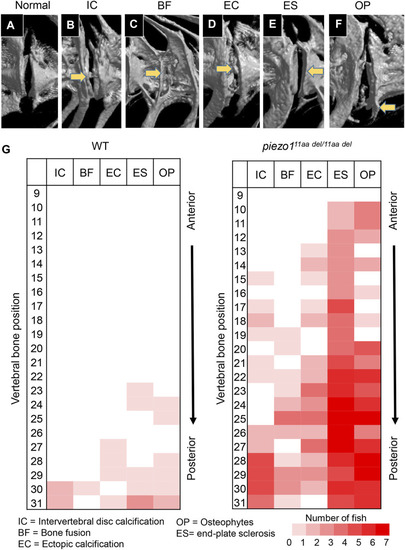
Abnormal changes of vertebral bone in |
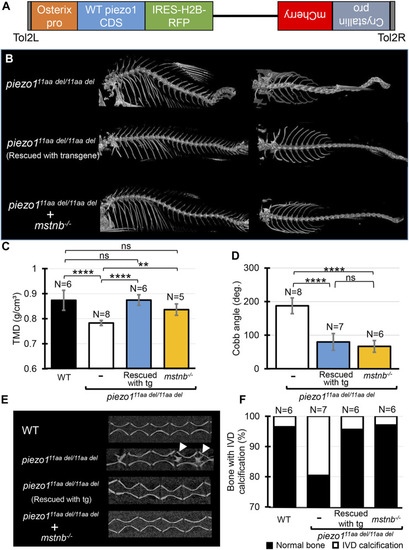
Introducing functional PHENOTYPE:
|