FIGURE

FIGURE 4

ID
ZDB-FIG-240124-42
Publication
Ramli et al., 2024 - Piezo1 mutant zebrafish as a model of idiopathic scoliosis
Other Figures
All Figure Page
Back to All Figure Page
FIGURE 4

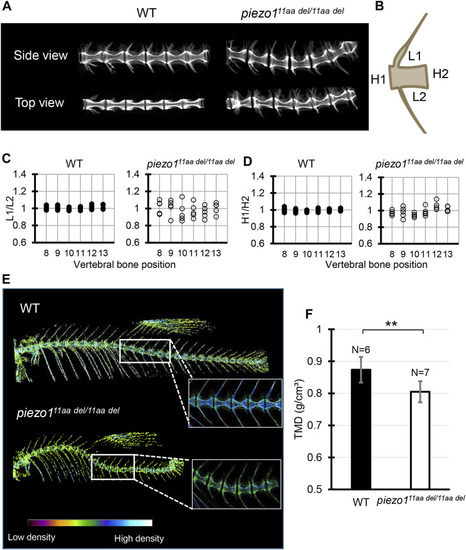
Detailed analysis of vertebra shape. (A) Comparison of 3D reconstruction of micro-CT images of vertebral bone between wildtype and piezo111aa del/11aa del at the abdominal part from side and top view. (B) Schematic diagram and quantification of the (C) length ratio (L1/L2) and (D) height ratio (H1/H2) of single vertebrae measurement. About 6 vertebrae from wildtype (N = 5) and mutant (N = 5) were assessed. Length aspect ratio and height aspect ratio were significantly more variable in mutant (p < 0.0001, analyzed using F-test two samples for variances). (E) The micro-CT reconstructions of 3 months zebrafish from both the wildtype and piezo111aa del/11aa del mutant specimens were performed. The reconstructions were color-enhanced to represent bone density value. To minimize measurement error, trunk or abdominal part was chosen to measure TMD value due to low bone kinks, indicated as white boxes. (F) Measurement of Tissue Mineral Density (TMD). Values are presented as mean ± SD and analyzed using Student’s t-test. **p < 0.01.

Expression Data

Expression Detail
Antibody Labeling
Phenotype Data
Fish:
Observed In:
Stage: Adult

Phenotype Detail
Acknowledgments
This image is the copyrighted work of the attributed author or publisher, and ZFIN has permission only to display this image to its users. Additional permissions should be obtained from the applicable author or publisher of the image. Full text @ Front Genet