FIGURE SUMMARY
Title

Pulsed stimulated Brillouin microscopy enables high-sensitivity mechanical imaging of live and fragile biological specimens

Authors
Yang, F., Bevilacqua, C., Hambura, S., Neves, A., Gopalan, A., Watanabe, K., Govendir, M., Bernabeu, M., Ellenberg, J., Diz-Muñoz, A., Köhler, S., Rapti, G., Jechlinger, M., Prevedel, R.
Source
Full text @ Nat. Methods

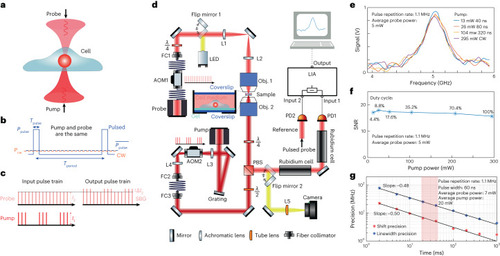
Pulsed-SBS approach and performance.

a, Pump and probe beams with a slightly different frequency counter-propagate and are focused inside a biological sample. b, Schematic of the optical power against time for the pulsed scheme (blue solid line) and the CW scheme (orange dashed line). c, SBG detection scheme. The pump beam is modulated at high frequency (320 kHz) at which the resulting amplitude modulation of the probe beam due to SBG can be measured. d, Schematic of the SBS setup. The pump and probe beams are focused in the same position using high NA (0.7) objective lenses. The intensity of the probe beam is measured by a photodiode, connected to the LIA. Brightfield imaging can be performed by flipping two mirrors into the optical path (yellow). Widefield fluorescence image is obtained by adding an excitation filter after the LED and an emission filter before the camera (not shown). e, Pulsed-SBS spectra of water under different pulse width but at the same peak power (thus different average power) while keeping the same average probe power to 5 mW. The pump pulse width ranges from 40 ns to CW and the corresponding average power ranges from 13 to 295 mW. Integration time is 20 ms. f, Quantification of SNR as a function of duty cycle and average pump power. g, Precision of the Brillouin shift and linewidth as a function of the integration time of the SBG spectrum of water. The precision is calculated as the standard deviation of the Brillouin shift and linewidth determined from the Lorentzian fits of n = 300 SBG spectra measured sequentially. The shaded region marks the integration time used in our experiments.

Source data

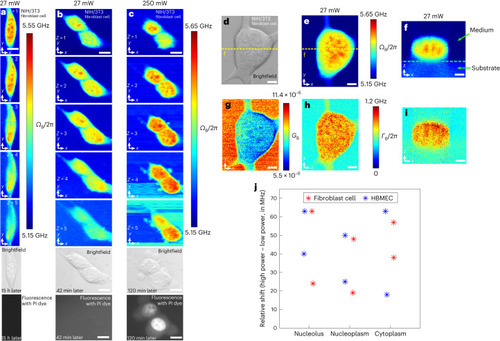
Pulsed-SBS imaging of cultured cells.

a, Three-dimensional sections of Brillouin shift images of a NIH/3T3 fibroblast cell under 20 mW pump and 7 mW probe with a z-step of 1 µm. The coregistered brightfield image and fluorescence image (15 h after Brillouin imaging) of the cell stained with PI dye are shown below. b, Three-dimensional Brillouin shift images of two fibroblast cells under 20 mW pump power and 7 mW probe power with a z-step of 1 µm. The brightfield and fluorescence images (42 min after Brillouin imaging) are shown below the Brillouin images. c, Three-dimensional Brillouin shift images of the same two cells under 240 mW pump power and 7 mW probe power after b with a z-step of 1 µm. Scale bars in ac are 10 µm. Note that the PI dye, a viability marker that indicates damaged membranes, is staining the nucleus. d, Brightfield image of a NIH/3T3 fibroblast cell. e,g,h, The Brillouin shift (ΩB) (e), Brillouin gain (GB) (g) and Brillouin linewidth (ΓB) (h) images of the xy plane. f,i, The Brillouin shift (f) and Brillouin linewidth (i) images of the xz plane along the dashed yellow line in d. The dashed green line in f marks the substrate (that is, PAA-based gel) boundary. Scale bars in di are 5 µm. j, Relative frequency up-shift of CW SBS with respect to pulsed SBS of three regions (nucleolus, nucleoplasm and cytoplasm) for (n = 4) cells between 27 mW power and 250 mW power. The average up-shifts in the nucleolus, nucleoplasm and cytoplasm regions are 47.5 MHz, 35.5 MHz and 44.0 MHz, respectively. All image pixel steps and pixel time are 0.25 µm × 0.25 µm and 20 ms, respectively.

Source data

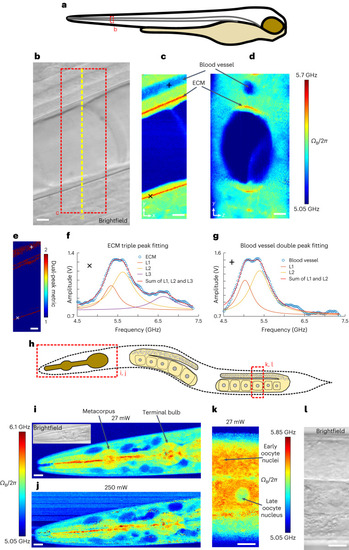
Pulsed-SBS imaging of zebrafish larvae and young adult C. elegans.

a, Illustration of a zebrafish larva, indicating the imaging region (dashed red box). b, Brightfield image of the notochord region of a zebrafish larva at 3 dpf stage. c, Brillouin shift image of the xy plane of the region marked by a red dashed box in b. d, Cross-sectional Brillouin shift image in the yz plane along the yellow dashed line in b. Scale bars in be are 5 µm. In c and d, the pixel steps in x and y directions are both 0.2 µm and the pixel time is 40 ms. e, Multi-peak metric map of the region marked by a red dashed box in b. f, A representative Brillouin spectrum in the high-shift region, indicative of ECM, marked by a cross in c and e. The raw spectrum and its triple-peak fitting are shown (L1–3). Note that an arbitrary offset was added to L1–3 for visualization. g, A representative Brillouin spectrum in the blood vessel region marked by a plus sign in c and e. The raw spectrum and its double-peak fitting (L1 and L2) are shown. Note that the offset was added to L1 and L2 for visualization. h, Schematics of a young adult C. elegans. The head and gonad regions imaged are marked by dashed red boxes. i,j, Brillouin shift images of the head region under 27 mW power (i) and 250 mW power (j). Note that slight movements of the nematode during high-power imaging blur out the contrast (c.f. i). In i and j, the pixel steps in x and y directions are both 0.5 µm and the pixel time is 20 ms. k,l, Brillouin shift image (k) and coregistered brightfield image (l) of the gonad region marked by a dashed red box in h, showing oocyte nuclei from different meiotic stages (arrows). In k, the pixel steps in x and y directions are both 0.25 µm and the pixel time is 20 ms. Scale bars in il are 10 µm.

Source data

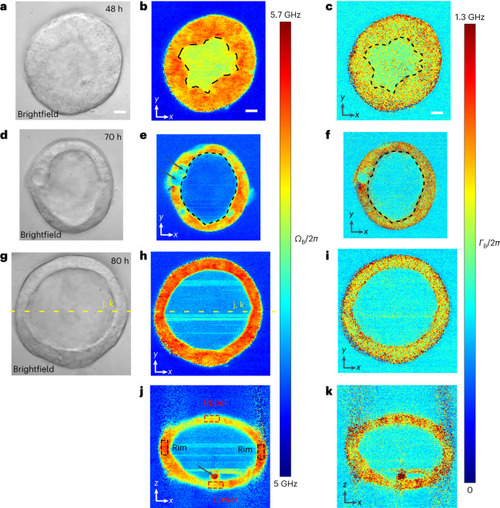
Pulsed-SBS imaging of mouse mammary gland organoids.
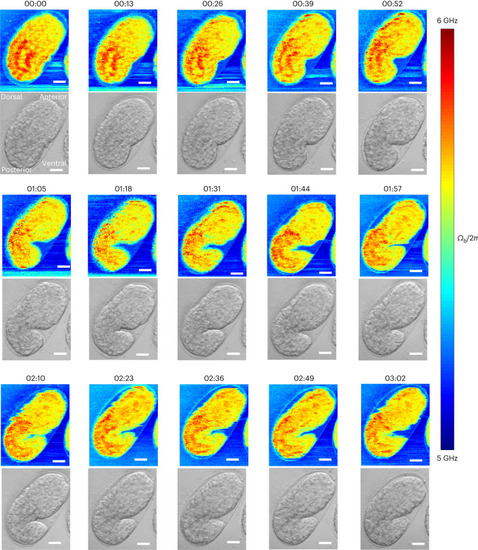
a, Brightfield image of an organoid 48 h post seeding singularized mammary epithelial cells into basement membrane matrix. b,c, Brillouin shift image (b) and Brillouin linewidth (c) image of the organoid in a. In b and c, the pixel steps in x and y directions are both 0.5 µm and the pixel time is 20 ms. d, Brightfield image of an organoid 70 h post seeding. e,f, Brillouin shift image (e) and Brillouin linewidth (f) image of the organoid in d. The average Brillouin linewidth in the lumen in f (FWHM 488 MHz) is 200 MHz decreased compared to c (FWHM 688 MHz) (representative of n = 3 organoids). Arrows in e highlight a dividing cell in cytokinesis. Dashed lines in bf demarcate organoid lumen. In e and f, the pixel steps in x and y directions are both 0.25 µm and the pixel time is 20 ms. g, Brightfield image of an organoid 80 h post seeding. h,i, Brillouin shift image (h) and Brillouin linewidth (i) image of the organoid in g. j,k, Brillouin shift image (j) and Brillouin linewidth (k) image of the xz plane marked with a dashed yellow line in g and h. The average Brillouin shift of the bended rim regions (black dashed boxes in j, average 5.56 GHz) shows a ~100 MHz up-shift compared to the average shift of the upper and lower cap of the epithelium (red dashed boxes in j, average 5.46 GHz) (representative of n = 4 organoids). A piece of debris, potentially a dead, extruded cell is marked with an arrow in j. In hk, the pixel steps in x and y directions are 0.5 µm and the pixel time 20 ms. Scale bars in all the images are 10 µm.

Time-lapse pulsed-SBS imaging of C. elegans embryo development.

Brillouin shift (top) and brightfield (bottom) images over a 3-h time span and at 13-min time interval (representative of n = 3 embryos). The pixel steps in x and y directions are 0.5 µm and the pixel time is 20 ms (total time per image 288 s). Scale bars in all the images are 10 µm. The embryo at the start of the time lapse is at the late ‘ball-stage’, slightly before the bean stage, or approximately at 300 min post-fertilization (mpf). Imaging time lapses presented here conclude at ~480 mpf, when embryos start their first spontaneous muscle contractions, known as ‘twitching’. Embryonic axes: top right is anterior, bottom left is posterior, right is ventral and left is dorsal.

Acknowledgments
This image is the copyrighted work of the attributed author or publisher, and ZFIN has permission only to display this image to its users. Additional permissions should be obtained from the applicable author or publisher of the image. Full text @ Nat. Methods