IMAGE

Fig. 2

ID
ZDB-IMAGE-231211-47
Source
Figures for Yang et al., 2023
Image
Figure Caption

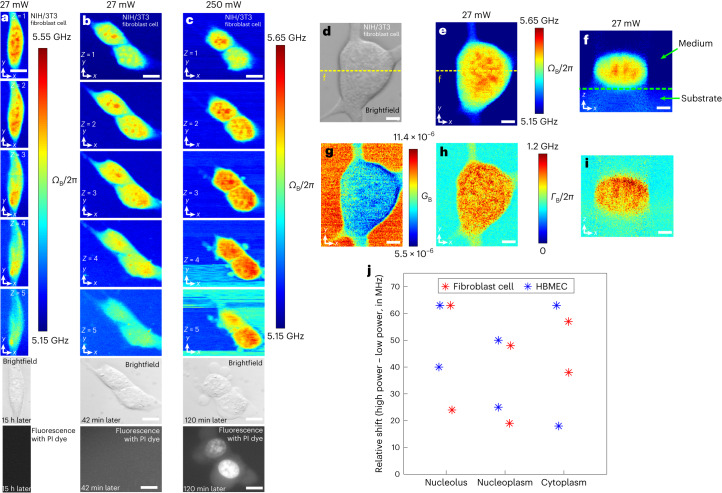
Fig. 2 Pulsed-SBS imaging of cultured cells.

a, Three-dimensional sections of Brillouin shift images of a NIH/3T3 fibroblast cell under 20 mW pump and 7 mW probe with a z-step of 1 µm. The coregistered brightfield image and fluorescence image (15 h after Brillouin imaging) of the cell stained with PI dye are shown below. b, Three-dimensional Brillouin shift images of two fibroblast cells under 20 mW pump power and 7 mW probe power with a z-step of 1 µm. The brightfield and fluorescence images (42 min after Brillouin imaging) are shown below the Brillouin images. c, Three-dimensional Brillouin shift images of the same two cells under 240 mW pump power and 7 mW probe power after b with a z-step of 1 µm. Scale bars in ac are 10 µm. Note that the PI dye, a viability marker that indicates damaged membranes, is staining the nucleus. d, Brightfield image of a NIH/3T3 fibroblast cell. e,g,h, The Brillouin shift (ΩB) (e), Brillouin gain (GB) (g) and Brillouin linewidth (ΓB) (h) images of the xy plane. f,i, The Brillouin shift (f) and Brillouin linewidth (i) images of the xz plane along the dashed yellow line in d. The dashed green line in f marks the substrate (that is, PAA-based gel) boundary. Scale bars in di are 5 µm. j, Relative frequency up-shift of CW SBS with respect to pulsed SBS of three regions (nucleolus, nucleoplasm and cytoplasm) for (n = 4) cells between 27 mW power and 250 mW power. The average up-shifts in the nucleolus, nucleoplasm and cytoplasm regions are 47.5 MHz, 35.5 MHz and 44.0 MHz, respectively. All image pixel steps and pixel time are 0.25 µm × 0.25 µm and 20 ms, respectively.

Source data

Acknowledgments
This image is the copyrighted work of the attributed author or publisher, and ZFIN has permission only to display this image to its users. Additional permissions should be obtained from the applicable author or publisher of the image. Full text @ Nat. Methods