IMAGE

Fig. 1

ID
ZDB-IMAGE-231211-53
Source
Figures for Yang et al., 2023
Image
Figure Caption

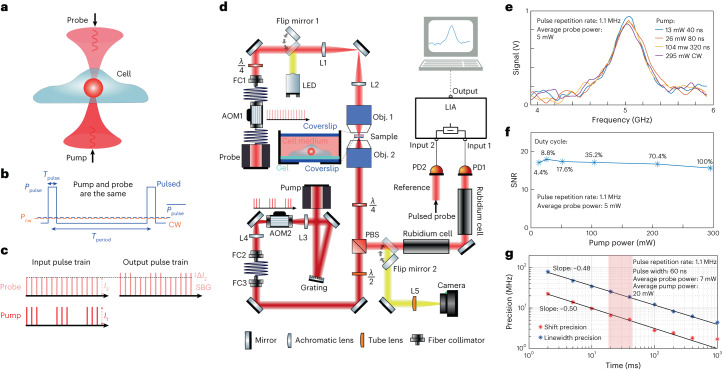
Fig. 1 Pulsed-SBS approach and performance.

a, Pump and probe beams with a slightly different frequency counter-propagate and are focused inside a biological sample. b, Schematic of the optical power against time for the pulsed scheme (blue solid line) and the CW scheme (orange dashed line). c, SBG detection scheme. The pump beam is modulated at high frequency (320 kHz) at which the resulting amplitude modulation of the probe beam due to SBG can be measured. d, Schematic of the SBS setup. The pump and probe beams are focused in the same position using high NA (0.7) objective lenses. The intensity of the probe beam is measured by a photodiode, connected to the LIA. Brightfield imaging can be performed by flipping two mirrors into the optical path (yellow). Widefield fluorescence image is obtained by adding an excitation filter after the LED and an emission filter before the camera (not shown). e, Pulsed-SBS spectra of water under different pulse width but at the same peak power (thus different average power) while keeping the same average probe power to 5 mW. The pump pulse width ranges from 40 ns to CW and the corresponding average power ranges from 13 to 295 mW. Integration time is 20 ms. f, Quantification of SNR as a function of duty cycle and average pump power. g, Precision of the Brillouin shift and linewidth as a function of the integration time of the SBG spectrum of water. The precision is calculated as the standard deviation of the Brillouin shift and linewidth determined from the Lorentzian fits of n = 300 SBG spectra measured sequentially. The shaded region marks the integration time used in our experiments.

Source data

Acknowledgments
This image is the copyrighted work of the attributed author or publisher, and ZFIN has permission only to display this image to its users. Additional permissions should be obtained from the applicable author or publisher of the image. Full text @ Nat. Methods