FIGURE SUMMARY
Title

Heterogeneity in quiescent Müller glia in the uninjured zebrafish retina drive differential responses following photoreceptor ablation

Authors
Krylov, A., Yu, S., Veen, K., Newton, A., Ye, A., Qin, H., He, J., Jusuf, P.R.
Source
Full text @ Front. Mol. Neurosci.

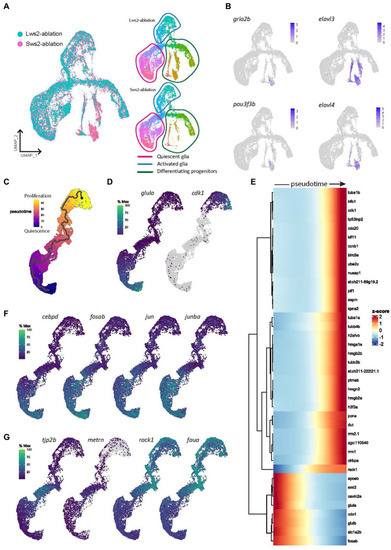
Gene expression modules in activated Müller glia following photoreceptor ablation. (A) UMAP plot of integrated Lws2 and Sws2-ablation scRNA-seq samples. (B) Differences in clusters between photoreceptor ablation samples is associated with differentiating Müller glia-derived progenitor cells. (C,D) Trajectory of integrated dataset along pseudotime from quiescent (glula) to late proliferating (cdk1) Müller glia. (E) Heatmap showing the top 40 differentially expressed genes along pseudotime from left to right, grouped together by gene modules. (F,G) Expression plots of differentially expressed markers along pseudotime.

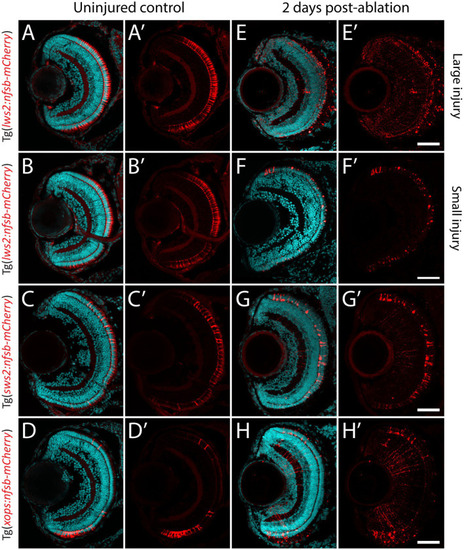
Photoreceptor ablation paradigms differing in subtype targeted, injury extent and injury location. (A–D) Distribution of mCherry positive, and nitroreductase (nfsb)-expressing long wavelength sensitive (Lws2) cones (A,B), short wavelength sensitive (Sws2) cones (C) and rod (Xops) photoreceptors (D). (E–H) Ablation of these photoreceptor subtypes is observed within 2 days exposure of metronidazole. A reduced metronidazole concentration and exposure duration leads to a smaller injury scale (B,F) compared to the original Lws2 injury (A,E). Scale bar = 50 μm.

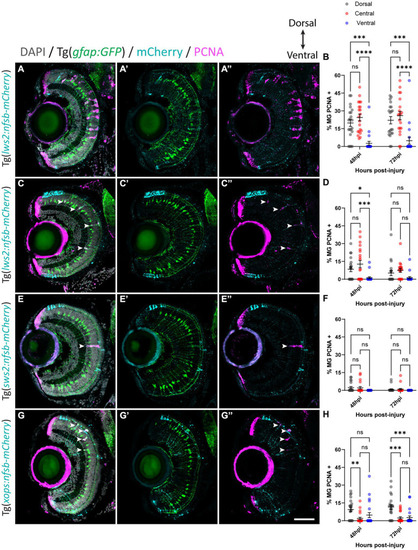
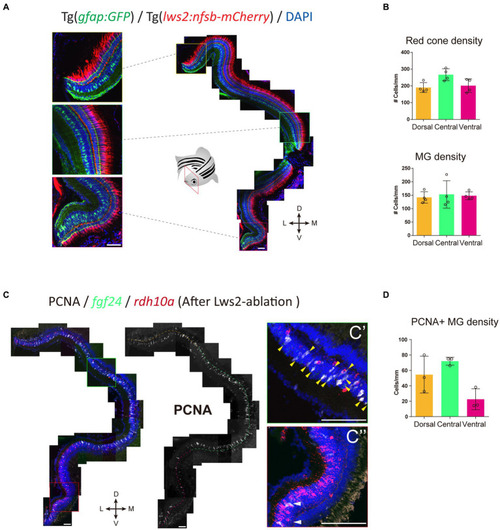
Müller glia subpopulations along the dorsal to ventral axis differ in their regenerative ability. Response of Müller glia following widespread Lws2 (A), smaller Lws2 (C), Sws2 (E) and Xops (G) ablation. Proliferation of Müller glia (labeled for PCNA; pink – see arrowheads) expressing GFP (green), driven by the promoter for glial fibrillary acidic protein (gfap). Nuclei are shown in gray. All retinal sections are orientated dorsal (top) to ventral (bottom). Quantifications of PCNA-positive Müller glia for each injury at 48 and 72 h post injury (hpi) in dorsal, central and ventral sectors (B,D,F,H). Scale bar = 50 μm.

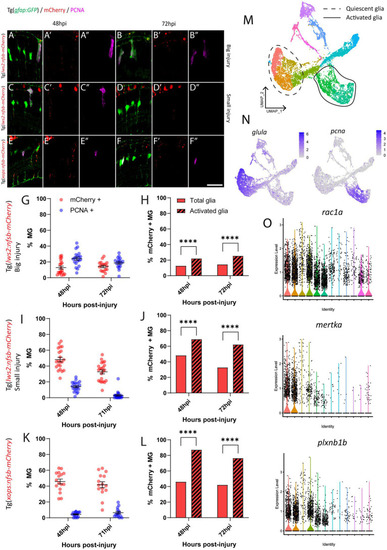
Investigation of phagocytosis and proliferation by Müller glia following photoreceptor ablation. (A–F) Micrograph images of Müller glia (Gfap-positive; green) detecting proliferative marker PCNA (pink) and photoreceptor debris (red) across three photoreceptor ablation paradigms. (G,I,K) Quantifications of the percentage of debris-containing, and proliferating Müller glia. (H,J,L) Cell counts presented as proportions of debris-containing Müller glia in PCNA+ and PCNA- populations. (M) UMAP plot of quiescent (dotted line) and proliferative (solid line) Müller glia clusters expressing glula and pcna, respectively, (N) from Lws2 ablation scRNAseq sample. (O) Violin Plots of the expression of phagocytosis associated markers rac1a, mertka, and plxnb1b. *p ≤ 0.05, **p ≤ 0.01, ***p ≤ 0.001, ****p ≤ 0.0001.

Heterogeneity exists in Müller glia of the uninjured zebrafish retina. (A) UMAP of FACS Müller glia and Müller glia-derived cells from the uninjured zebrafish retina at 9 days post-fertilization (dpf), revealing six clusters of quiescent Müller glia (C1-C6). (B) Expression plots of proliferating (pcna), immature cells (her4.1 and igfbp5b), and differentiating neurons (crx, neurod4 and elavl3). (C) Expression of mature Müller glia markers in the identified quiescent Müller glia. (D) Enrichment term analysis summarized as 5 gene ontology (GO) terms for each clusters C1-C6. Circle size depicts the gene ratio and circle color depicts the adjusted negative log p-value of significance. (E) Expression of top genes across clusters C1–C6. Circle size and circle color represents percentage of expressing cells per cluster and average log-fold expression value, respectively.

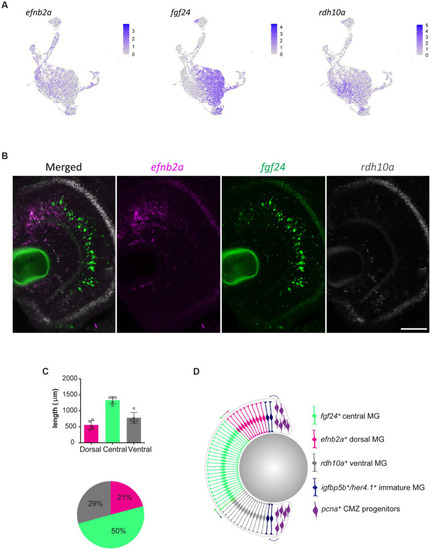
Molecularly distinct Müller glia subpopulations differ in their spatial location. (A) Expression plots of key markers efnb2a, fgf24, and rdh10a. (B) RNAscope in situ hybridization of genes presented in (A), highlighting their location throughout the dorsal (top) to ventral (bottom) retina. Scale bar = 50 μm. (C) Length (μm) in the retina of 12 month-old zebrafish retina domains of in situ labeling. (D) Schematic summary of the location of efnb2a (pink), fgf24 (green), rdh10a (gray)-expressing Müller glia, in addition to igfbp5b/her4.1-expressing immature Müller glia and pcna-expressing ciliary margin zone progenitor cells.

fgf24+ Müller glia are primed to proliferate upon red cone ablation in adult zebrafish. (A) The distribution of red (Lws2) cones and Müller glia in the adult retina. (B) Quantifications of the density of red cones and Müller glia in each spatial domain. (C) Red cone ablation significantly induces central Müller glia to proliferate and label for PCNA. Yellow arrows indicate fgf24+/PCNA+ Müller glia (C′), while white arrows indicate rdh10a+/PCNA+ Müller glia (C″). (D) Quantifications of the density of PCNA+ Müller glia in each spatial domain. Scale bar = 50 μm.

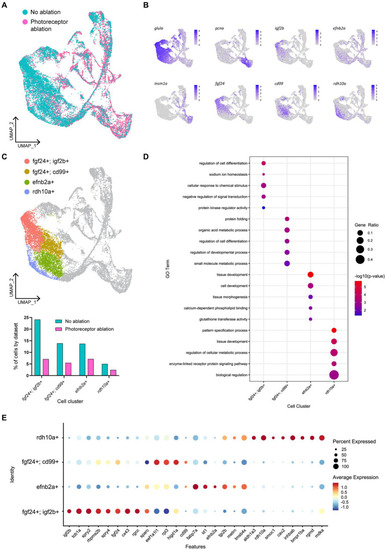
Müller glia heterogeneity persists in the presence of photoreceptor ablation. (A) UMAP plot of FACS Müller glia with integration of uninjured (no ablation) and photoreceptor ablation single cell RNA-sequencing samples. (B) Expression plots of quiescent (glula), proliferating (pcna) and differentiating (insm1a) cells, as well as key markers distinguishing quiescent Müller glia clusters. (C) UMAP plot highlighting quiescent Müller glia clusters that can be distinguished based on the expression of the following markers: fgf24, igf2b, cd99, efnb2a, and rdh10a. Graph indicates the percentage of cells belonging to each cell cluster and the proportion between each sample. (D) Enrichment term analysis of genes expressed in each quiescent cluster and the gene ontology (GO) terms relating to these genes. Circle size and circle color depict gene ratio and negative log-adjusted p-value, respectively. (E) Expression of key markers linked to quiescent Müller glia heterogeneity that persist in the presence of photoreceptor ablation. Circle size indicates percentage of cells expressing the relevant gene and circle color indicates the average log-fold expression value.

Acknowledgments
This image is the copyrighted work of the attributed author or publisher, and ZFIN has permission only to display this image to its users. Additional permissions should be obtained from the applicable author or publisher of the image. Full text @ Front. Mol. Neurosci.