IMAGE

Figure 4

ID
ZDB-IMAGE-230814-8
Source
Figures for Krylov et al., 2023
Image
Figure Caption

Figure 4

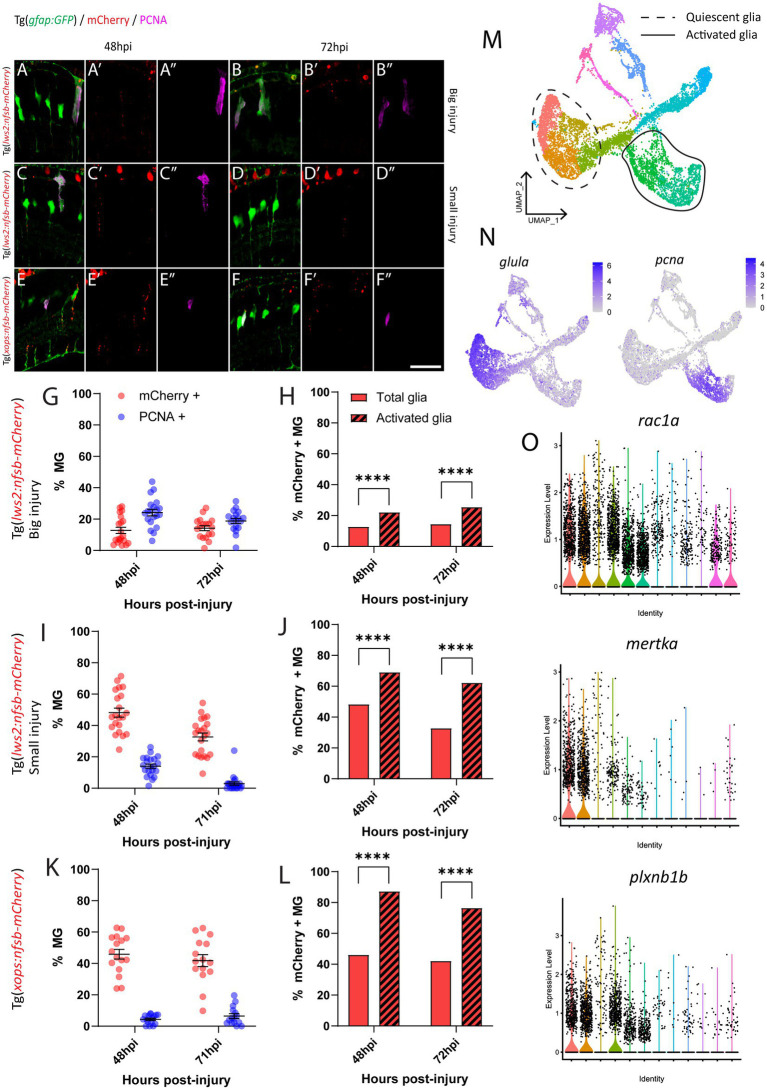
Investigation of phagocytosis and proliferation by Müller glia following photoreceptor ablation. (A–F) Micrograph images of Müller glia (Gfap-positive; green) detecting proliferative marker PCNA (pink) and photoreceptor debris (red) across three photoreceptor ablation paradigms. (G,I,K) Quantifications of the percentage of debris-containing, and proliferating Müller glia. (H,J,L) Cell counts presented as proportions of debris-containing Müller glia in PCNA+ and PCNA- populations. (M) UMAP plot of quiescent (dotted line) and proliferative (solid line) Müller glia clusters expressing glula and pcna, respectively, (N) from Lws2 ablation scRNAseq sample. (O) Violin Plots of the expression of phagocytosis associated markers rac1a, mertka, and plxnb1b. *p ≤ 0.05, **p ≤ 0.01, ***p ≤ 0.001, ****p ≤ 0.0001.

Acknowledgments
This image is the copyrighted work of the attributed author or publisher, and ZFIN has permission only to display this image to its users. Additional permissions should be obtained from the applicable author or publisher of the image. Full text @ Front. Mol. Neurosci.