FIGURE

Figure 8

ID
ZDB-FIG-230814-9
Publication
Krylov et al., 2023 - Heterogeneity in quiescent Müller glia in the uninjured zebrafish retina drive differential responses following photoreceptor ablation
Other Figures
All Figure Page
Back to All Figure Page
Figure 8

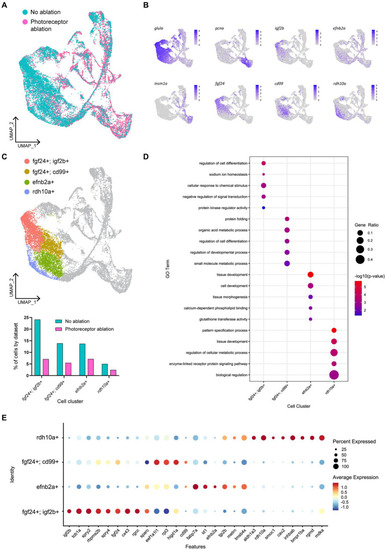
Müller glia heterogeneity persists in the presence of photoreceptor ablation. (A) UMAP plot of FACS Müller glia with integration of uninjured (no ablation) and photoreceptor ablation single cell RNA-sequencing samples. (B) Expression plots of quiescent (glula), proliferating (pcna) and differentiating (insm1a) cells, as well as key markers distinguishing quiescent Müller glia clusters. (C) UMAP plot highlighting quiescent Müller glia clusters that can be distinguished based on the expression of the following markers: fgf24, igf2b, cd99, efnb2a, and rdh10a. Graph indicates the percentage of cells belonging to each cell cluster and the proportion between each sample. (D) Enrichment term analysis of genes expressed in each quiescent cluster and the gene ontology (GO) terms relating to these genes. Circle size and circle color depict gene ratio and negative log-adjusted p-value, respectively. (E) Expression of key markers linked to quiescent Müller glia heterogeneity that persist in the presence of photoreceptor ablation. Circle size indicates percentage of cells expressing the relevant gene and circle color indicates the average log-fold expression value.

Expression Data

Expression Detail
Antibody Labeling
Phenotype Data

Phenotype Detail
Acknowledgments
This image is the copyrighted work of the attributed author or publisher, and ZFIN has permission only to display this image to its users. Additional permissions should be obtained from the applicable author or publisher of the image. Full text @ Front. Mol. Neurosci.