FIGURE SUMMARY
Title

Mechanical force regulates Sox9 expression at the developing enthesis

Authors
Subramanian, A., Kanzaki, L.F., Schilling, T.F.
Source
Full text @ Development

Tenocytes at cranial muscle attachments express scxa, sox9a and col1a. (A-C) Single-plane ventral views, anterior to the left, of 72 hpf zebrafish embryos showing in situ hybridization chain reaction (isHCR) staining for expression of sox9a (green), scxa (magenta) and col1a1a (cyan) mRNA at cranial muscle-cartilage attachments (entheses). (D) Similar view of cell nuclei labeled with DAPI. (E-G) Z-stack ventral views of 72 hpf Tg(sox10:gfp;BAC scx:mCherry) embryos stained by immunofluorescence for GFP (E), mCherry (F) and myosin heavy chain (MHC; G). (H) Cartoon showing a ventral view of a 72 hpf embryo illustrating chondrocytes expressing sox9a (green) and tenocytes expressing scxa (red), with dual expression of both genes in tenocytes of entheses. (I-K) Z-stack ventral views, anterior to the left, of 96 hpf embryos stained by immunofluorescence for Col2a (I), Tsp4b (J) and Col2a/Tsp4b colocalization (K). (L-N) Z-stack ventral views of 5 dpf embryos stained by immunofluorescence for Col1a (L), Tsp4b (M) and Col1a/Tsp4b colocalization (N). Arrowheads indicate tendons (white) and ligaments (orange) attaching with mc, ch, pq and bh cartilages. Yellow asterisks show the developing entheseal ECM of the ch-SH tendon. (O) Cartoon showing ECM organization of a tendon attaching a muscle to a mammalian long bone, with fibrocartilage and Col2a+ matrix near the bony junction (green), Col1a-rich matrix in the tendon midbody (blue) and Tsp4 (red) in the myotendinous junction (MTJ). (P) Cartoon showing ECM organization of the elongated tendon in zebrafish attaching the SH muscle to the ch cartilage, with similar Col2a+ (green), Col1a+ (blue) and Tsp4+ (red) defining similar regions. AM – adductor mandibularis; bh-IMP-IH, basihyal-intermandibularis posterior-interhyal; ch, ceratohyal; ch-HH, ceratohyal-hyohyal tendon; ch-IH, ceratohyal-interhyal tendon; ch-SH, ceratohyal-sternohyoideus tendon; HH, hyohyal; IMA; intermandibularis anterior; IMP, intermandibularis posterior; Mc, Meckels cartilage; mc-AM, Meckels adductor mandibularis tendon; mc-IMA, Meckels-intermandibularis anterior tendon; mc-pq, Meckels-palatoquadrate ligament; pq, palatoquadrate; pq-AM, palatoquadrate-adductor mandibularis tendon. Scale bars: 20 μm.

scxa and sox9a are co-expressed in tenocytes of putative entheses of cranial tendons during embryonic development. (A-O) Ventral views, anterior to the left, of the developing mc cartilages of the lower jaws of zebrafish embryos showing isHCR staining for expression of sox9a (green), scxa (magenta) and col1a1a (cyan) mRNA at the mc-IMA enthesis at 48 hpf (A-E), 55 hpf (F-J) and 60 hpf (K-O). Surface volumes traced from DAPI-stained nuclei of cartilage (green) and tenocytes (red) within the enthesis region (dashed boxes) were created to quantify expression (D,E,I,J,N,O). (P,Q) Plots show quantification of fluorescence intensity within the tenocyte surface volume for scxa and sox9a expression and mean fluorescence level (P), and ratios of scxa to sox9a for the stages indicated (Q). n=4 embryos per stage, eight cells per embryo. Error bars show standard deviation. Linear mixed effects model was created and Tukey post-hoc pairwise comparison was performed. *P<0.05, **P<0.01, ***P<0.001. Scale bars: 20 μm (A-D,F-I,K-N); 5 μm (insets, E,J,O).

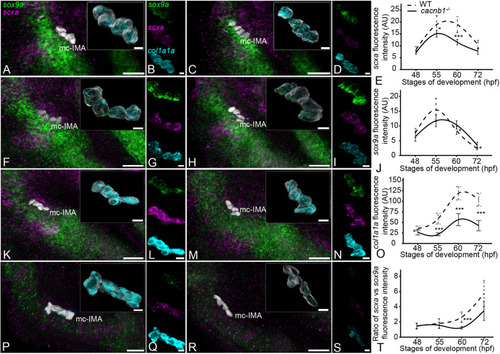
Paralysis regulates expression of scxa, sox9a and col1a1a in the embryonic mc-IMA enthesis. (A-S) Ventral views, anterior to the left, of wild-type (WT) (A,B,F,G,K,L,P,Q) and cacnb1−/− (C,D,H,I,M,N,R,S) embryos showing expression of scxa (magenta), sox9a (green) and col1a1a (cyan) genes at the mc-IMA tendon enthesis at 48 hpf (A-D), 55 hpf (F-I), 60 hpf (K-N) and 72 hpf (P-S). Plots show quantification of scxa (E), sox9a (J), col1a1a (O) expression and ratio of scxa versus sox9a expression (T) in WT (dotted line) and cacnb1−/− (solid line) tenocytes for the stages indicated. Error bars show standard deviation. Linear mixed effects model was created and Tukey post-hoc pairwise comparison was performed. *P<0.05, ***P<0.001. Scale bars: 20 μm (A,C,F,H,K,M,P,R); 5 μm (insets, B,D,G,I,L,N,Q,S).

Muscle contraction regulates expression of scxa, sox9a and col1a1a in the embryonic enthesis. (A-H) Ventral views, anterior to the left, of wild-type not stimulated (WT-NS) (A,B), wild-type stimulated (WT-S) (C,D), aBgtx-injected not stimulated (Bgtx-NS) and aBgtx-injected stimulated (Bgtx-S) embryos showing expression of scxa (magenta), sox9a (green) and col1a1a (cyan) genes at the mc-IMA enthesis at 60 hpf. (I,J) Violin plots showing expression level as quantified by measuring fluorescence intensity from isHCRs of scxa (I) and sox9a (J) in WT-NS and Bgtx-NS and WT-S and Bgtx-S at 72 hpf. (K) Violin plots showing ratios of scxa versus sox9a expression in in WT-NS and Bgtx-NS and WT-S and Bgtx-S at 72 hpf. N=4 embryos per developmental stage and nine tenocytes per embryo. Horizontal line in each distribution shows median value. Linear mixed effects model was created and Tukey post-hoc pairwise comparison was performed. *P<0.05, **P<0.01, ***P<0.001. Scale bars: 20 μm (A,C,E,G); 5 μm (insets, B,D,F,H).

Inhibition of TGFβ signaling regulates scxa and sox9a expression in embryonic entheseal tenocytes. (A-F) Ventral views, anterior to the left, of 72 hpf embryos showing fluorescence signal from isHCRs of scxa and sox9a of ch-IH entheseal tenocytes treated with DMSO (A,B), 50 μM SB431542 (C,D) or 50μM SB525334 (E,F). (G,H) Violin plots depicting fluorescence intensity (AU) of scxa (G) and sox9a (H) in tenocytes treated with DMSO, 50 μM SB431542 or 50 μM SB525334. Each data point represents an individual tenocyte from four embryos (ten tenocytes per embryo) for each condition. (I) Violin plot depicting ratio of scxa to sox9a expression as fluorescence intensity. Horizontal line in each distribution shows median value. Linear mixed effects model was created and Tukey post-hoc pairwise comparison was performed. **P<0.01, ***P<0.001. Scale bars: 20 μm (A,C,E); 5 μm (insets, B,D,F).

Model for role of muscle contraction in enthesis development. (A) Mechanical force from muscle contraction regulates the balance of sox9a and scxa expression resulting in a higher ratio of scxa to sox9a expression in the tenocytes further away from the cartilage/bone. Balanced co-expression of scxa and sox9a regulates composition of enthesis ECM. (B) Lack of mechanical force in paralyzed embryos leads to higher levels of sox9a and no change in scxa expression at the enthesis, leading to a lower ratio of scxa to sox9a in the tenocytes, which causes changes in the enthesis ECM making it less elastic and more predominantly fibrocartilage.

Acknowledgments
This image is the copyrighted work of the attributed author or publisher, and ZFIN has permission only to display this image to its users. Additional permissions should be obtained from the applicable author or publisher of the image. Full text @ Development