IMAGE

Fig. 5.

ID
ZDB-IMAGE-230825-55
Source
Figures for Subramanian et al., 2023
Image
Figure Caption

Fig. 5.

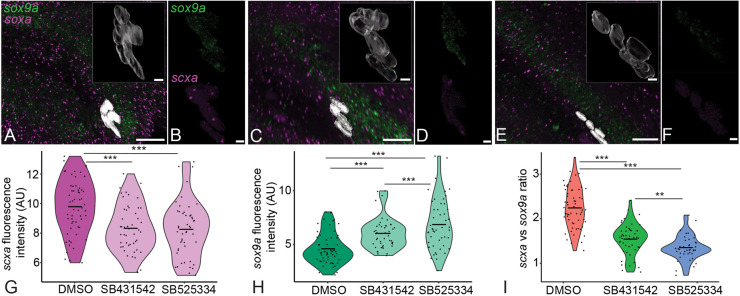
Inhibition of TGFβ signaling regulates scxa and sox9a expression in embryonic entheseal tenocytes. (A-F) Ventral views, anterior to the left, of 72 hpf embryos showing fluorescence signal from isHCRs of scxa and sox9a of ch-IH entheseal tenocytes treated with DMSO (A,B), 50 μM SB431542 (C,D) or 50μM SB525334 (E,F). (G,H) Violin plots depicting fluorescence intensity (AU) of scxa (G) and sox9a (H) in tenocytes treated with DMSO, 50 μM SB431542 or 50 μM SB525334. Each data point represents an individual tenocyte from four embryos (ten tenocytes per embryo) for each condition. (I) Violin plot depicting ratio of scxa to sox9a expression as fluorescence intensity. Horizontal line in each distribution shows median value. Linear mixed effects model was created and Tukey post-hoc pairwise comparison was performed. **P<0.01, ***P<0.001. Scale bars: 20 μm (A,C,E); 5 μm (insets, B,D,F).

Acknowledgments
This image is the copyrighted work of the attributed author or publisher, and ZFIN has permission only to display this image to its users. Additional permissions should be obtained from the applicable author or publisher of the image. Full text @ Development