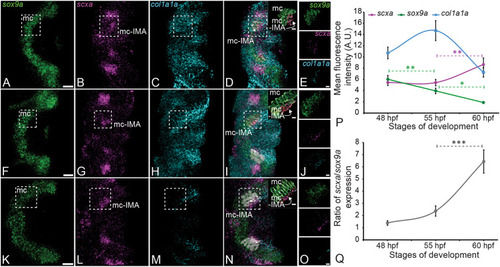
scxa and sox9a are co-expressed in tenocytes of putative entheses of cranial tendons during embryonic development. (A-O) Ventral views, anterior to the left, of the developing mc cartilages of the lower jaws of zebrafish embryos showing isHCR staining for expression of sox9a (green), scxa (magenta) and col1a1a (cyan) mRNA at the mc-IMA enthesis at 48 hpf (A-E), 55 hpf (F-J) and 60 hpf (K-O). Surface volumes traced from DAPI-stained nuclei of cartilage (green) and tenocytes (red) within the enthesis region (dashed boxes) were created to quantify expression (D,E,I,J,N,O). (P,Q) Plots show quantification of fluorescence intensity within the tenocyte surface volume for scxa and sox9a expression and mean fluorescence level (P), and ratios of scxa to sox9a for the stages indicated (Q). n=4 embryos per stage, eight cells per embryo. Error bars show standard deviation. Linear mixed effects model was created and Tukey post-hoc pairwise comparison was performed. *P<0.05, **P<0.01, ***P<0.001. Scale bars: 20 μm (A-D,F-I,K-N); 5 μm (insets, E,J,O).
|
