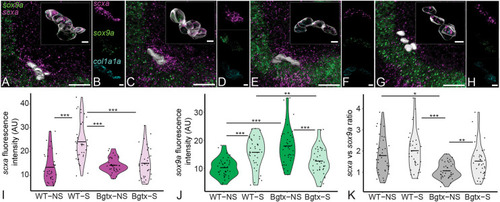
Muscle contraction regulates expression of scxa, sox9a and col1a1a in the embryonic enthesis. (A-H) Ventral views, anterior to the left, of wild-type not stimulated (WT-NS) (A,B), wild-type stimulated (WT-S) (C,D), aBgtx-injected not stimulated (Bgtx-NS) and aBgtx-injected stimulated (Bgtx-S) embryos showing expression of scxa (magenta), sox9a (green) and col1a1a (cyan) genes at the mc-IMA enthesis at 60 hpf. (I,J) Violin plots showing expression level as quantified by measuring fluorescence intensity from isHCRs of scxa (I) and sox9a (J) in WT-NS and Bgtx-NS and WT-S and Bgtx-S at 72 hpf. (K) Violin plots showing ratios of scxa versus sox9a expression in in WT-NS and Bgtx-NS and WT-S and Bgtx-S at 72 hpf. N=4 embryos per developmental stage and nine tenocytes per embryo. Horizontal line in each distribution shows median value. Linear mixed effects model was created and Tukey post-hoc pairwise comparison was performed. *P<0.05, **P<0.01, ***P<0.001. Scale bars: 20 μm (A,C,E,G); 5 μm (insets, B,D,F,H).
|
