IMAGE

Fig. 3.

ID
ZDB-IMAGE-230825-53
Source
Figures for Subramanian et al., 2023
Image
Figure Caption

Fig. 3.

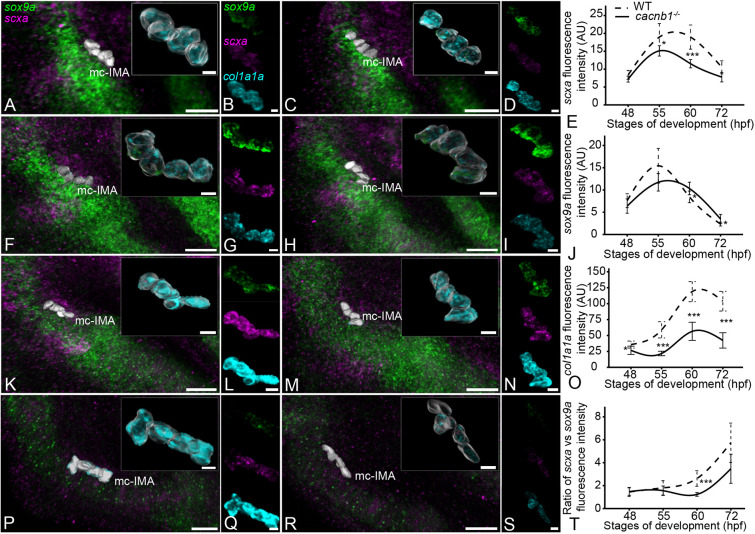
Paralysis regulates expression of scxa, sox9a and col1a1a in the embryonic mc-IMA enthesis. (A-S) Ventral views, anterior to the left, of wild-type (WT) (A,B,F,G,K,L,P,Q) and cacnb1−/− (C,D,H,I,M,N,R,S) embryos showing expression of scxa (magenta), sox9a (green) and col1a1a (cyan) genes at the mc-IMA tendon enthesis at 48 hpf (A-D), 55 hpf (F-I), 60 hpf (K-N) and 72 hpf (P-S). Plots show quantification of scxa (E), sox9a (J), col1a1a (O) expression and ratio of scxa versus sox9a expression (T) in WT (dotted line) and cacnb1−/− (solid line) tenocytes for the stages indicated. Error bars show standard deviation. Linear mixed effects model was created and Tukey post-hoc pairwise comparison was performed. *P<0.05, ***P<0.001. Scale bars: 20 μm (A,C,F,H,K,M,P,R); 5 μm (insets, B,D,G,I,L,N,Q,S).

Acknowledgments
This image is the copyrighted work of the attributed author or publisher, and ZFIN has permission only to display this image to its users. Additional permissions should be obtained from the applicable author or publisher of the image. Full text @ Development