FIGURE SUMMARY
Title

Nerve growth factor receptor (Ngfr) induces neurogenic plasticity by suppressing reactive astroglial Lcn2/Slc22a17 signaling in Alzheimer's disease

Authors
Siddiqui, T., Cosacak, M.I., Popova, S., Bhattarai, P., Yilmaz, E., Lee, A.J., Min, Y., Wang, X., Allen, M., İş, Ö., Atasavum, Z.T., Rodriguez-Muela, N., Vardarajan, B.N., Flaherty, D., Teich, A.F., Santa-Maria, I., Freudenberg, U., Werner, C., Tosto, G., Mayeux, R., Ertekin-Taner, N., Kizil, C.
Source
Full text @ NPJ Regen Med

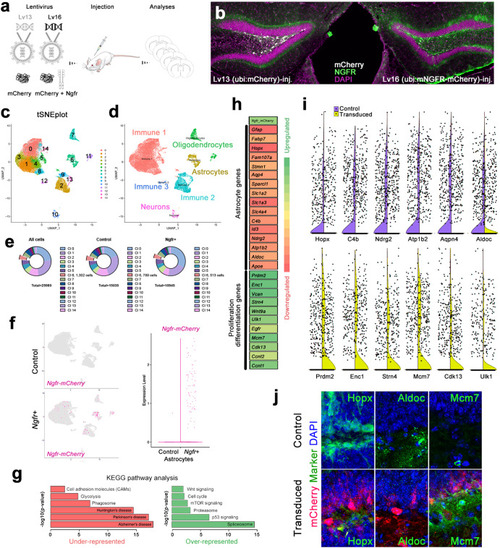
NGFR enhances proliferative and neurogenic markers in dentate gyrus (DG) astrocytes.

a Schematic strategy for expression lentiviruses: Lv13: mCherry control; Lv16: Ngfr-mCherry. b Cross section images for DGs transduced with Lv13 and Lv16 and immunostained for mCherry, NGFR with DAPI counterstain. Note NGFR expression in the subgranular zone (SGZ) after Lv16 transduction. c Single cell transcriptomics tSNE plot from dissected DGs after Lv13 and Lv16 transduction. d tSNE plots indicating cell types. e Number of cells sequenced and their distribution to individual cell types. f tSNE plots from Lv13 and Lv16 transduction showing the expression of Ngfr-mCherry, which is detectable only after Lv16. g KEGG pathway analyses on astrocytic population, showing downregulated and upregulated pathways. h A heat map for selected differentially expressed genes (DEGs) after Lv16. Astrocyte markers are downregulated, and proliferation/neurogenesis markers are upregulated. i Violin plots for selected genes: purple: control (Lv13); yellow (Lv16). j Immunostaining for validating the DEGs in control and Lv16-transduced DG. Scale bars equal 50 μm.

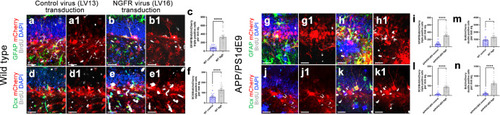
NGFR promotes proliferation of DG astrocytes and neurogenesis in wild type and APP/PS1dE9 model of AD.

Immunostaining for GFAP, BrdU and mCherry with DAPI counterstain in Lv13- (a) and Lv16- (b) SGZ of wild type mice. a1, b1. BrdU/mCherry channels of a and b. c Quantification graph for mCherry-BrdU-GFAP triple positive cells. d, e Immunostaining for Dcx, BrdU and mCherry with DAPI counterstain in Lv13- (a) and Lv16-transduced (b) SGZ. d1, e1. BrdU/mCherry channels of d and e. f Quantification graph for mCherry-BrdU-Dcx triple positive cells of wild type mice. Immunostaining for GFAP, BrdU and mCherry with DAPI counterstain in Lv13- (g) and Lv16-transduced (h) SGZ of APP/PS1dE9 mice. g1, h1. BrdU/mCherry channels of g and h. i Quantification graph for mCherry-BrdU-GFAP triple positive cells. Immunostaining for Dcx, BrdU and mCherry with DAPI counterstain in Lv13- (j) and Lv16-transduced (k) SGZ of APP/PS1dE9 mice. j1, k1. BrdU/mCherry channels of j and k. l Quantification graph for mCherry-BrdU-Dcx triple positive cells. m Quantification of BrdU/mCherry double positive cells in wild type mice (control and Ngfr+). n Quantification of BrdU/mCherry double positive cells in APP/PS1dE9 mice (control and Ngfr+). Scale bars equal 50 µm. Error bars represent the standard error of the means, with each point representing one section. 3 mice were used.

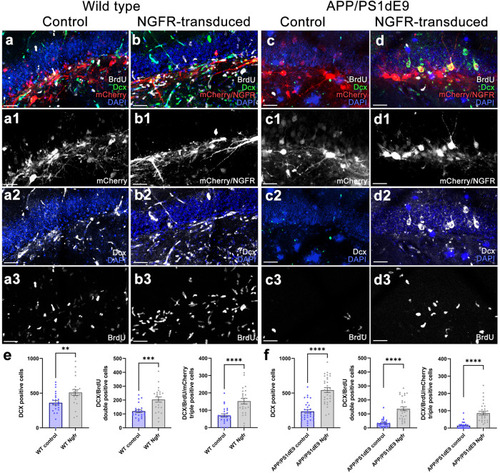
Lv16 transduction enhances neurogenesis in wild type and APP/PS1dE9 mouse model of Alzheimer’s disease.

a Dcx, mCherry, and BrdU triple immunostaining with DAPI counterstain in Lv13-transduced wild type mouse dentate gyrus. a1. mCherry channel of a. a2. Dcx and DAPI channel of a. a3. BrdU channel of a. b Dcx, mCherry, and BrdU triple immunostaining with DAPI counterstain in Lv16-transduced wild type mouse dentate gyrus. b1. mCherry channel of b. b2. Dcx and DAPI channel of b. b3. BrdU channel of b. c Dcx, mCherry, and BrdU triple immunostaining with DAPI counterstain in Lv13-transduced APP/PS1dE9 mouse dentate gyrus. c1. mCherry channel of c. c2. Dcx and DAPI channel of c. c3. BrdU channel of c. d Dcx, mCherry, BrdU triple immunostaining with DAPI counterstain in Lv1613-transduced APP/PS1dE9 mouse dentate gyrus. d1. mCherry channel of d. d2. Dcx and DAPI channel of d. d3. BrdU channel of d. e Normalized values of Dcx-positive, BrdU-Dcx double positive and BrdU-Dcx-mCherry triple positive cells in wild type mouse dentate gyrus transduced with Lv13 (control) or Lv16 (NGFR). f Normalized values of Dcx-positive, BrdU-Dcx double positive and BrdU-Dcx-mCherry triple positive cells in APP/PS1dE9 mouse dentate gyrus transduced with Lv13 (control) or Lv16 (NGFR). Scale bars equal 50 μm. Error bars represent standard error of the means, with each point representing one section. Y-axes represent numbers per mm2. 3 mice were used.

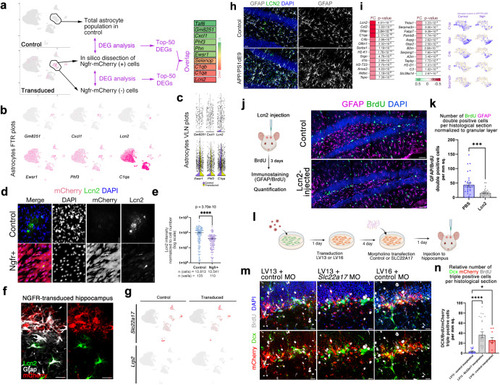
Ngfr regulates neurogenic response in DG astrocytes through suppression of Lcn2/Slc22a17 activity.

a Single cell transcriptomics strategy for isolating Ngfr-mCherry positive astrocytes and comparing the transcriptomics profiles to non-transduced astrocytes or control astrocytes. The comparison showed differential expression of 10 genes in common as shown in the heat map. b Expression of selected genes on tSNE plots. c Violin plots for selected genes. d Immunostaining for Lcn2 and mCherry with DAPI counterstain in control and Ngfr+ mouse hippocampal astrocytes. e Quantification of Lcn2 signal intensity normalized to cell numbers. f Immunostaining for Lcn2, Gfap and mCherry in LV16 Ngfr-transduced DG. Lcn2-positive and mCherry positive astrocytes do not overlap. g tSNE plots for two receptors of Lcn2: Lrp2, Slc22a17. h Gfap and Lcn2 immunostaining indicates increased Lcn2 and gliosis in APP/PS1dE9 mice. i Heatmap showing the changes in astrocyte A1 state markers upon Ngfr+ transduction. Astrocyte cluster 6 clusters showing expression of C1qa, Gfap, C4b, Il1b, and Serpina3n in control and Ngfr+ states. j Injection, BrdU treatment and analyses scheme of the effect of Lcn2 on proliferating GFAP cells, and immunohistochemical staining for BrdU, GFAP and DAPI. k Quantification graph for BrdU-GFAP double positive cells. l Schematic representation of the cell-type specific functional knockdown of Slc22a17 in astrocytes. m mCherry, Dcx, BrdU immunostaining with DAPI counterstain in SGZs transplanted with Lv13+control morpholino, Lv13+Slc22a17 morpholino and Lv16+control morpholino-treated astrocytes. Lower panels: DAPI omitted from upper panels n Quantification of Dcx, mCherry and BrdU triple positive cells in i. Slc22a17 knockdown mimics Ngfr transduction. n = 3. Scale bars equal 25 μm. Error bars represent standard error of the means.

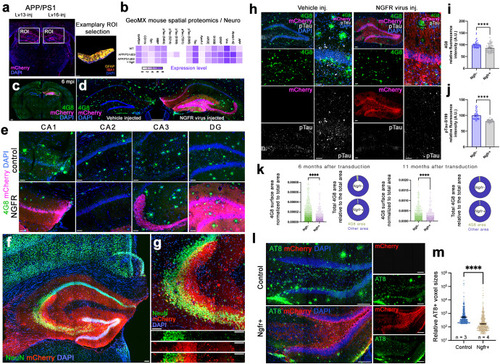
Ngfr reduces Aβ42 load and phosphorylated Tau in the hippocampus of APP/PS1dE9 mice.

a Representative image from GeoMx spatial proteomics mouse brain section and region of interest (ROI) at the SGZ. b Heatmap showing the detection levels of selected proteins after Ngfr transduction in wild type and APP/PS1dE9 mice. c Representative APP/PS1dE9 mouse brain section immunostained for 4G8 and mCherry with DAPI counterstain at 6 months after transduction with Lv16 in one DG. d High-magnification image from c. e Comparison of amyloid load in CA1, CA2, CA3 and DG regions of control and Ngfr-transduced hemispheres. f Double immunostaining for NeuN and mCherry with DAPI counterstain at 6 months after transduction. g Higher magnification image of f. Individual channel panels indicate overlapping mCherry and NeuN. h Quantification of amyloid load in terms of normalized amyloid immunoreactivity by comparing control (v) versus Ngfr (Lv16) transduction. n = 5. i. 4G8, mCherry, phosphorylated Tau-S199 immunostaining with DAPI counterstain in control and Ngfr-injected DGs. Individual fluorescence channels and close-up images are also shown. j Quantification of pTau-S199 in terms of normalized fluorescence by comparing control (v) versus Ngfr (Lv16) transduction. n = 5. k 4G8 surface area quantification and relative 4G8 area graphs for 6 months and 11 months after Ngfr transduction. l Double immunolabeling for AT8 and mCherry with DAPI counterstain in control and Ngfr+ animals. Individual panels show single fluorescent channels. m Quantification of relative AT8 immunoreactivity. Ngfr reduces the prevalence of AT8. Error bars represent standard error of the means. Scale bars equal 100 μm.

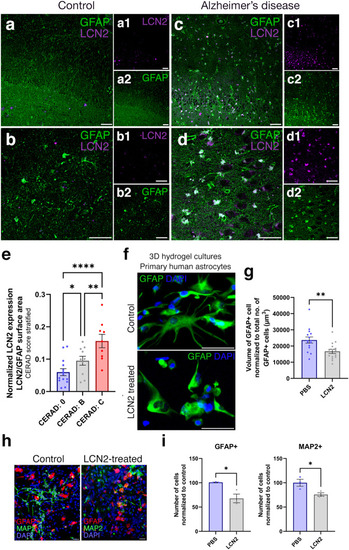
LCN2 is upregulated in human brains with AD.

Immunohistochemical stainings for LCN2 and GFAP on hippocampal brain sections of healthy control (a, b) and CERAD score C AD patient (c, d). Black-white insets (a1d2) indicate individual fluorescent channels. LCN2 (top) and GFAP (bottom). e Quantification of LCN2-positive GFAP cells normalized to total GFAP cells. In total n = 7 human brains, n = 21 images analyzed. ***p < 0.001. f Immunostaining for GFAP on primary human astrocytes in 3D hydrogels: control and LCN2-treated. g Quantification of the volume of GFAP normalized to total number of GFAP cells. LCN2-treatment reduces the volume of astroglia, indicative or reactive states. Scale bars equal 50 μm. h GFAP and MAP2 immunostaining on control and LCN2-treated 3D hydrogel cultures of human primary fetal astroglia. i Quantification of normalized GFAP and MAP2-positive cells after the culture period. Scale bars equal 25 μm. Error bars represent standard error of the means.

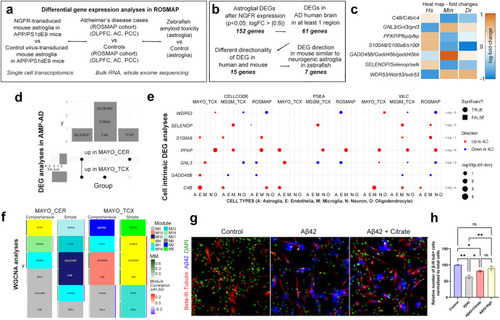
Comparison of gene expression changes in mouse brain with NGFR to human AD cohorts by differential gene expression analyses, cell intrinsic gene expression and Weighted gene co-expression network analysis.

a Schematic flow of the differential gene expression analyses with ROSMAP AD cohort. b Stringency criteria and number of genes in each comparison category. c Heat map of expression changes of 7 candidate genes. Hs: human, Mm: mouse, Dr: zebrafish. d Overlap of significant DEG (FDR < 0.05 in the AMP-AD datasets. e Cell-intrinsic DEGs in 5 different cell types calculated using 3 different analytic tools (CellCODE, PSEA, WLC) from 3 different datasets (Mayo, MSSM, ROSMAP). Color indicates direction of changes. Circles are significant changes (p < 0.05) while squares are not. f The gene of interest and their assigned modules (tile color) in WGCNA networks constructed from Mayo CER and TCX datasets either adjusting (comprehensive) or not adjusted (simple) for the cell proportion changes. Red-Blue color tile to the right indicates module correlation to AD diagnosis, where only significant correlation (p < 0.05) is shown. Green tile to the left indicates the gene’s module membership with respect to its assigned module. g Beta-III-tubulin and Aβ42 immunocytochemical staining with DAPI counterstain on control, Aβ42-treated and Aβ42+citrate-treated primary human astrocytes. h. Quantification of neurons in conditions in g and Aβ42-treated Ngfr-transduced primary human astrocytes. Scale bars equal 25 μm. Error bars represent standard error of the means.

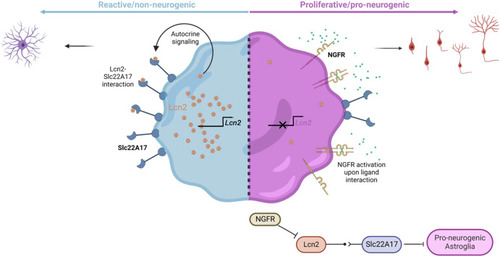
Schematic view of the NGFR/LCN2/SLC22A17-dependent neurogenic switch mechanism in astroglia.

Nerve growth factor receptor can convert reactive astroglia to neurogenic state in mouse model of Alzheimer’s disease (AD) through suppression of Lcn2 activity on Slc22a17 receptor. In AD cohorts in humans, NGFR is co-expressed with a weighed expression cluster including PFKP, blockage of which enhances neurogenesis from astroglia. In zebrafish, Ngfr activity determines the neuroregenerative potential after amyloid toxicity. We propose an evolutionarily conserved mechanism relating to neurogenesis-related brain resilience in vertebrates.

Acknowledgments
This image is the copyrighted work of the attributed author or publisher, and ZFIN has permission only to display this image to its users. Additional permissions should be obtained from the applicable author or publisher of the image. Full text @ NPJ Regen Med