IMAGE

Fig. 7

ID
ZDB-IMAGE-230712-13
Source
Figures for Siddiqui et al., 2023
Image
Figure Caption

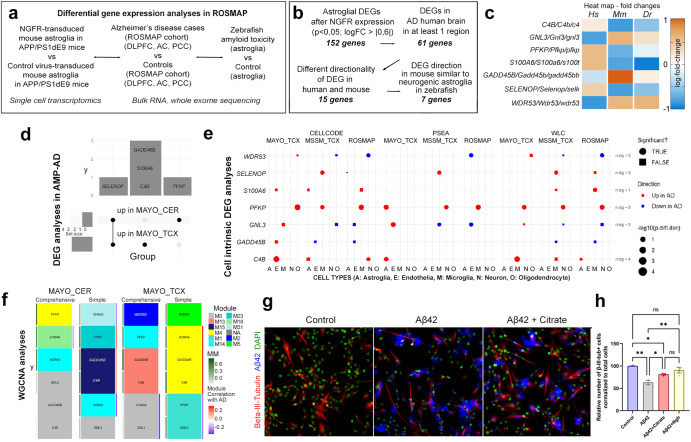
Fig. 7 Comparison of gene expression changes in mouse brain with NGFR to human AD cohorts by differential gene expression analyses, cell intrinsic gene expression and Weighted gene co-expression network analysis.

a Schematic flow of the differential gene expression analyses with ROSMAP AD cohort. b Stringency criteria and number of genes in each comparison category. c Heat map of expression changes of 7 candidate genes. Hs: human, Mm: mouse, Dr: zebrafish. d Overlap of significant DEG (FDR < 0.05 in the AMP-AD datasets. e Cell-intrinsic DEGs in 5 different cell types calculated using 3 different analytic tools (CellCODE, PSEA, WLC) from 3 different datasets (Mayo, MSSM, ROSMAP). Color indicates direction of changes. Circles are significant changes (p < 0.05) while squares are not. f The gene of interest and their assigned modules (tile color) in WGCNA networks constructed from Mayo CER and TCX datasets either adjusting (comprehensive) or not adjusted (simple) for the cell proportion changes. Red-Blue color tile to the right indicates module correlation to AD diagnosis, where only significant correlation (p < 0.05) is shown. Green tile to the left indicates the gene’s module membership with respect to its assigned module. g Beta-III-tubulin and Aβ42 immunocytochemical staining with DAPI counterstain on control, Aβ42-treated and Aβ42+citrate-treated primary human astrocytes. h. Quantification of neurons in conditions in g and Aβ42-treated Ngfr-transduced primary human astrocytes. Scale bars equal 25 μm. Error bars represent standard error of the means.

Acknowledgments
This image is the copyrighted work of the attributed author or publisher, and ZFIN has permission only to display this image to its users. Additional permissions should be obtained from the applicable author or publisher of the image. Full text @ NPJ Regen Med