IMAGE

Fig. 2

ID
ZDB-IMAGE-230712-8
Source
Figures for Siddiqui et al., 2023
Image
Figure Caption

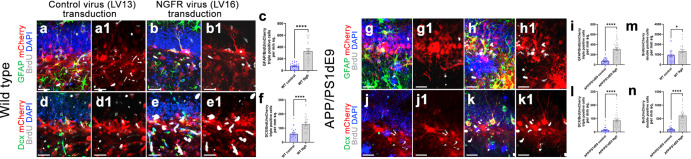
Fig. 2 NGFR promotes proliferation of DG astrocytes and neurogenesis in wild type and APP/PS1dE9 model of AD.

Immunostaining for GFAP, BrdU and mCherry with DAPI counterstain in Lv13- (a) and Lv16- (b) SGZ of wild type mice. a1, b1. BrdU/mCherry channels of a and b. c Quantification graph for mCherry-BrdU-GFAP triple positive cells. d, e Immunostaining for Dcx, BrdU and mCherry with DAPI counterstain in Lv13- (a) and Lv16-transduced (b) SGZ. d1, e1. BrdU/mCherry channels of d and e. f Quantification graph for mCherry-BrdU-Dcx triple positive cells of wild type mice. Immunostaining for GFAP, BrdU and mCherry with DAPI counterstain in Lv13- (g) and Lv16-transduced (h) SGZ of APP/PS1dE9 mice. g1, h1. BrdU/mCherry channels of g and h. i Quantification graph for mCherry-BrdU-GFAP triple positive cells. Immunostaining for Dcx, BrdU and mCherry with DAPI counterstain in Lv13- (j) and Lv16-transduced (k) SGZ of APP/PS1dE9 mice. j1, k1. BrdU/mCherry channels of j and k. l Quantification graph for mCherry-BrdU-Dcx triple positive cells. m Quantification of BrdU/mCherry double positive cells in wild type mice (control and Ngfr+). n Quantification of BrdU/mCherry double positive cells in APP/PS1dE9 mice (control and Ngfr+). Scale bars equal 50 µm. Error bars represent the standard error of the means, with each point representing one section. 3 mice were used.

Acknowledgments
This image is the copyrighted work of the attributed author or publisher, and ZFIN has permission only to display this image to its users. Additional permissions should be obtained from the applicable author or publisher of the image. Full text @ NPJ Regen Med