
- Title
-
A spatiotemporal barrier formed by Follistatin is required for left-right patterning
- Authors
- Fu, X.X., Zhuo, D.H., Zhang, Y.J., Li, Y.F., Liu, X., Xing, Y.Y., Huang, Y., Wang, Y.F., Cheng, T., Wang, D., Chen, S.H., Chen, Y.J., Jiang, G.N., Lu, F.I., Feng, Y., Huang, X., Ma, J., Liu, W., Bai, G., Xu, P.F.
- Source
- Full text @ Proc. Natl. Acad. Sci. USA

fsta is downstream of Nodal signaling and required for LR asymmetry of zebrafish. (A) WISH of fsta in 10 hours post-fertilization (hpf) zebrafish embryos. (B) From left to right: expression of fsta in zebrafish embryos injected with ndr2 mRNA in one blastomere of the animal pole at the 128-cell stage, or ndr1, ndr2, ndr1 and ndr2 MO at the 1-cell stage, and in tdgf1 zygotic mutant or maternal-zygotic mutant zebrafish embryos. (A and B) Numbers in the bottom right of panels indicate the number of embryos with the phenotype shown out of the total number of embryos examined. At least 34 embryos were examined in each experiment. (C) Schematic diagram showing the positions of ATG (translation start site) and splicing MO of fsta; the guide RNA(gRNA) target site; the deletions of two fsta mutant lines generated using CRISPR/Cas9; and the predicted truncated Fsta (Δ5/Δ4) proteins (predicted domains taken from the Uniprot database). (D) The positions of heart and cardiac looping of WT and fstaΔ5/Δ5 embryos were analyzed using the cardiomyocyte marker myl7. The LR patterning of digestive organs including the liver, pancreas and intestines were analyzed using foxa3. (E) The epithalamic LR patterning of WT and fstaΔ5/Δ5 embryos was analyzed using the parapineal marker gfi1ab, pineal and parapineal marker otx5, and habenula markers kctd12.1, kctd12.2, and slc18a3b. Red triangles indicate asymmetric expression. Grey stacks indicate absence of expression. (D and E) Statistics are shown on the right of the representative photos, “n” indicates the numbers of examined embryos. At least 49 embryos were examined in each experiment. DV, dorsal view; LV, lateral view. (Scale bar, 200 μm.) |

Loss of or gain of function of fsta affects the LR patterning of the Nodal signaling pathway in zebrafish. (A) LR asymmetric genes spaw in the LPM, lefty1 (lft1) and ndr2 in the forebrain analyzed using WISH in WT and fstaΔ5/Δ5 embryos. Grey stacks indicate absence of expression. At least 22 embryos were examined in each experiment. (B) Expression areas of spaw in WT and fstaΔ5/Δ5 embryos were calculated. myod1 was used to indicate the developmental stage. **P < 0.01. At least 10 embryos were examined in each experiment. (A and B) Statistics are shown on the right of the representative photos, “n” indicates the numbers of examined embryos. (C) Schematic diagram of experimental setup for (D) expression of spaw and lefty1 in the light-induced fsta overexpression embryos. (E) Schematic diagram of experimental setup for (F) expression of spaw in zebrafish embryos implanted with Bovine Serum Albumin (BSA)- or rhFST-soaked beads in the left side at the indicated stages. Red triangles indicate the anterior boundary of spaw expression. (D and F) Numbers in the bottom right of panels indicate the number of embryos with the phenotype shown out of the total number of embryos examined. At least a total of 22 embryos were examined in each experiment. (Scale bar, 200 μm.) |
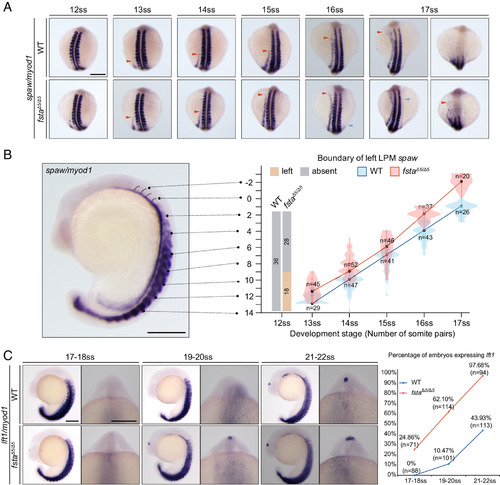
Fsta restricts the transmission of spaw in the LPM and prevents early activation of lefty1 in the forebrain of zebrafish. (A) PA propagation of spaw from 12 to 17-somite stage (ss) in WT and fstaΔ5/Δ5 embryos. myod1 is used to indicate the development stage. Red triangles indicate the anterior boundary of spaw expression in the left LPM. Blue triangles indicate the anterior boundary of spaw expression in the right LPM. (B) The violin plot shows the statistics of (A), rectangles indicate the middle two quadrants in the distribution and black dots indicate the median. Negative numbers indicate that the anterior boundary of spaw has crossed the first somite. The ratio and numbers of embryos that have spaw expression in the left LPM of WT and fstaΔ5/Δ5 at 12ss are shown in the histogram. (C) Forebrain expression of lefty1 in WT and fstaΔ5/Δ5 embryos at the indicated stages. Statistics are shown on the right, “n” indicates the numbers of examined embryos. At least 20 embryos were examined in each experiment. (Scale bar, 200 μm.) |

Zebrafish Fsta is a secreted protein that can physically interact with spaw. (A) Projection of images from confocal stacks to show cilia (acetylated tubulin, red) in the KV of WT and fstaΔ5/Δ5 embryos. DAPI staining to show the nuclei of KV cells. (B) WISH of spaw and lefty1 to show the LR patterning and midline in WT and fstaΔ5/Δ5 embryos. (C) Interaction of Fsta-Flag/FstaΔ5-Flag with Enhanced Green Fluorescent Protein (EGFP) -Spaw in zebrafish embryos as assessed using Co-IP. (D) Schematic diagram of experimental setup for (E) in vivo interaction between Fsta-TurboID or FstaΔ5-TurboID with EGFP-Spaw as analyzed using proximity-dependent biotinylation catalysis. A hollow triangle indicates proprotein, a black triangle indicates mature protein of EGFP-Spaw. (F) Synthesis and secretion analysis of Fsta-Flag and FstaΔ5-Flag in HEK293T cells after transfection with Fsta-Flag or FstaΔ5-Flag plasmid for 48 h. Cells and conditioned medium (CM) were collected for western blot separately. (G) Schematic diagram of experimental setup for (H) projection of images from confocal stacks for Fsta secretion analysis. fsta-mCherry or fstaΔ5-mCherry + H2B-GFP mRNA were injected into one blastomere on the animal pole at the 128-cell stage and then imaged at the sphere stage. Secreted WT Fsta-mCherry can be seen in the extracellular spaces throughout the embryo, while almost no extracellular signaling of FstaΔ5-mCherry could be detected. (A, B, and H) Numbers in the bottom right of panels indicate the number of embryos with the phenotype shown out of the total number of embryos examined. At least 10 embryos were examined in each experiment. (Scale bar, 50 μm.) |

Fsta regulates LR asymmetry of the zebrafish forebrain by inhibiting Activin. (A and B) Expression of lefty1 (A) and ndr2 (B) in the forebrain in WT and fstaΔ5/Δ5 embryos injected with spaw, inhbb, spaw + inhbb MO or smad2 MO. Uninjected embryos were used as control. Statistics are shown below, “n” indicates the numbers of examined embryos. At least 34 embryos were examined in each experiment. Yellow stacks indicate right side expression of ndr2. (C and D) Interaction of Fsta-Flag/FstaΔ5-Flag/FstaΔ4-Flag with HA-Inhbb in zebrafish embryos as assessed using Co-IP. (Scale bar, 100 μm.) |

Fsta antagonizes the activity of Spaw and Activin by blocking binding to their receptors. (A) Schematic diagram of experimental setup for (B) WISH of lefty1 is used for a readout of Nodal/Activin activity. Immunostaining of EGFP shows grafted cells. Donor cells from embryos injected with EGFP mRNA or + fsta or truncated fsta mRNA (Δ5/Δ4/ΔTB) were grafted into host embryos that were overexpressed with spaw or inhbb. WT embryos were used as control. Numbers in the bottom right of panels indicate the number of embryos with the phenotype shown out of the total number of embryos examined. At least 20 embryos were examined in each experiment. (C) Interaction of Fsta–Flag, EGFP–Spaw, and HA–Tdgf1 in zebrafish embryos as assessed using competitive protein binding assay. (D) Interaction of EGFP–Spaw with its candidate receptors in zebrafish embryos as assessed using Co-IP. (E) Interaction of Fsta–Flag, EGFP–Spaw, and Acvr2ab–HA in zebrafish embryos as assessed using competitive protein binding assays. (F) Interaction of Fsta–Flag, EGFP–Spaw, and Acvr1bb–HA in zebrafish embryos as assessed using competitive protein binding assays. (Scale bar, 100 μm.) |

Fst is required for the LR patterning of Chick and Xenopus. (A) Expression pattern of FST in chick embryos at indicated stages. (B) Expression of NODAL in WT and FST MO transfected chick embryos at the indicated stages. (C) Schematic diagram of experimental setup for (D) expression of NODAL in chick embryos implanted with BSA- or rhFst-soaked beads on the left side of the embryos at the indicated stages. (E) Expression patterns of fst in Xenopus embryos at indicated stages. (A and B, D and E) Numbers in the bottom right of panels indicate the number of embryos with the phenotype shown out of the total number of embryos examined. At least four embryos were examined in each experiment. (F) Schematic diagram of experimental setup for (G) expression of nodal1 in Xenopus tropicalis embryos injected with fst gRNAs + Cas9 or (I) with fst mRNA into one cell at the two-cell stage. Uninjected embryos were used as control. Red triangles indicate the expression of nodal1. (H and J) Statistics of (G) and (I), “n” indicates the numbers of examined embryo. At least 41 embryos were examined in each experiment. (Scale bar, 200 μm.) |

Working model of Fst function as a molecular barrier of LR asymmetry in the LPM (Zebrafish, Chick, and Frog) and Epithalamus (zebrafish). Briefly, Nodal induced fst to express bilaterally on both sides of the developing embryos. Under the function of LRO, Nodal signaling is weaker in the right LPM where it is completely blocked by Fst, while stronger Nodal in the left LPM can overcome the inhibition of Fst and spread from PA regions, though still restricted as it does so by Fst. In zebrafish, Activin could induce ndr2/lefty1 expression in the forebrain, but this is then suppressed by Fst at an early stage. When Spaw arrives, as emanated from the left LPM, this helps overcome the suppression of Fst so that ndr2/lefty1 can be turned on in the left side of the forebrain. |