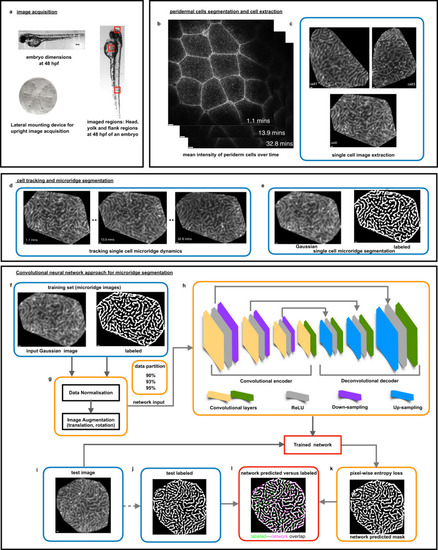
Live imaging, image processing pipeline for a neural network approach for microridge segmentation.

a Zebrafish embryo dimensions were measured at 48 hpf and a custom-built embryo mounting device was designed for live image acquisition of one lateral side of the head, yolk, and flank embryo regions. b Mean intensity of the filtered periderm cell slices at all time points. c Membrane segmentation steps lead to demarcated cell boundaries and single-cell extraction. d Nearest centroid distance-based cell tracking allowed following each cell’s microridge dynamics. e Fully-automated custom-built microridge segmentation algorithm formed the labeled set for the deep learning segmentation strategy (Supplementary Fig. 1, Methods). f Convolutional neural network for microridge segmentation. The training set consisted of pairs of extracted cell patterns and their binarized images, illustrated in (b, e). g Prior to training, data normalization and data augmentation steps were implemented. Data were randomly partitioned into 90, 93, and 95% of the total set and various combinations of hyperparameters are trialed in the training process. h The convolutional encoder-decoder architecture consisting of a convolutional encoder and decoder layers (yellow and green), ReLU layers (gray), downsampling (purple), and upsampling layers (blue) yielded a trained network for each set of hyperparameters. i, j The network accuracy was assessed on the remaining test dataset (10, 7, and 5%, respectively) by pixel-wise comparison of network predicted and labeled outputs. k Trained network predictions on test data using pixel-wise entropy loss. l Labeled versus network-predicted outputs for assessing the network performance. (Scale bars indicate 1 pixel as 0.1977 μm in be and after image re-sizing for CNN to be 0.098 μm in fk).

Trained network selection based on predicted accuracy versus network hyperparameters and visual inspection of pixel-wise segmentation.

a 3D stem plot shows how the mini-batch size (MBS) and maximum epoch (ME) affect the network performance, measured by the mean IOU. For each proportion of the training set, the MBS and ME values were varied as (6, 9, 11, and 15) and (400, 500, 600, and 800) to yield 16 combinations of these hyperparameters. Typically, better accuracy is achievable for smaller MBS and a larger ME, for which our tested combinations of hyperparameters showed performances above ~90% mean IOU. b, c An exemplary single yolk and flank pattern (1 pixel is 0.098 μm and 0.08 μm), respectively, fed to the selected trained network. d, e Trained network-segmented outputs for MBS = 6 and ME = 800 using the 93% training dataset (1397 randomly chosen microridge patterns). f, g Pixel-wise overlap between images labeled using the conventional microridge segmentation pipeline and network-segmented images, shown in green pixels and magenta pixels, respectively; common regions in white (microridges) or black (background). The performance measure is given by mean IOU for each cell pattern.

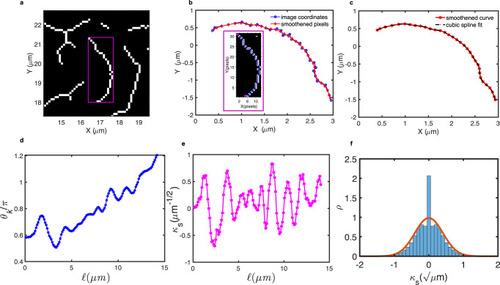
Estimation of persistence length for in vivo microridges.

a A magenta box demarcates the 2D sub-image of a skeletonized microridge branch for estimation of Lp. b Microridge skeleton contours (blue) were smoothened using a Gaussian fit (red curve). The inset shows a microridge skeleton (blue line) with the endpoints of the contour (magenta) used to obtain the boundary trace that returned the discrete x–y coordinates. c A cubic spline interpolation on the Gaussian smoothened microridge trace contours preserved the sequence of points to give several intermediate points. d Tangent angle (θk) along the length () of the microridge. e Rescaled κs along the length () of the microridge contour. f Distribution of κs of microridges from 1052 cells (293, 1084, and 125 from the flank, yolk, and head, respectively) fitted to a Gaussian distribution (red line trace), whose variance gives an estimate of the effective persistence length (Lp) as ~6.1 μm.

Population level comparison of cell patterns from yolk versus flank regions.

Example of a network segmented a yolk pattern b flank cell pattern, both shown in false color representing image intensities scaled between 0–1, indicated by the colorbar. c Box plot of pattern wavelength (λ) parameter with estimated medians of 0.66 and 0.60 μm measured from network segmented binary cell images of yolk and flank regions computed over 300 yolk and 293 flank cells, respectively. d Box plots of yolk and flank cell population mean microridge branch lengths (<Bl>) per cell yielding median values of 1.68 μm and 1.60 μm, respectively quantified from their skeletonized microridge branches.

Actin clusters within the microridges exhibit positional fluctuations.

ad The raw image intensity (in false color) of a representative microridge indicated the presence of actin clusters traversing along the microridge lengths across time frames. e Microridge tracking allowed extraction of a one-dimensional intensity profile along the same microridge at each timepoint. Each line color indicates the intensity profile, labeled by the time in minutes, showing the intensity fluctuations within the microridges. High-intensity peaks oscillate in position along microridge lengths. f A high-resolution STED imaged with lateral pixel size 0.022 μm in x and y and z-depth of 0.22 μm confirmed the clustered intensity spots within the microridges labeled with Utr-gfp.

Acknowledgments
This image is the copyrighted work of the attributed author or publisher, and ZFIN has permission only to display this image to its users. Additional permissions should be obtained from the applicable author or publisher of the image. Full text @ NPJ Syst Biol Appl