IMAGE

Fig. 4

ID
ZDB-IMAGE-230605-30
Source
Figures for Bhavna et al., 2023
Image
Figure Caption

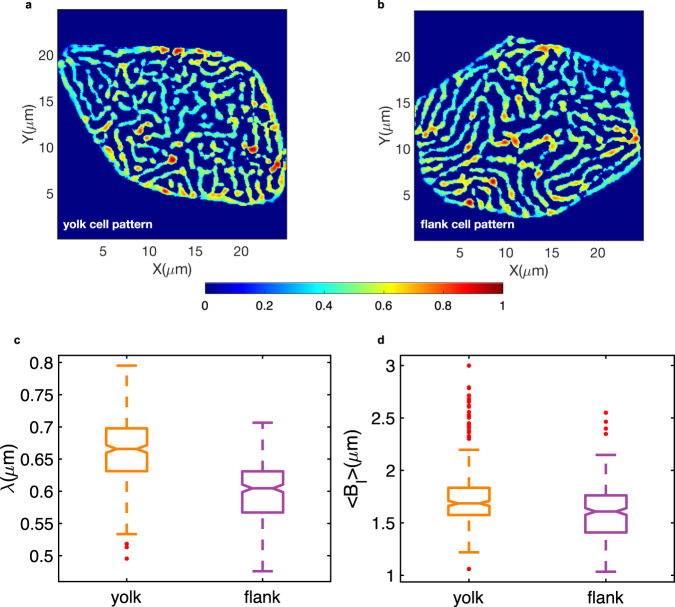
Fig. 4 Population level comparison of cell patterns from yolk versus flank regions.

Example of a network segmented a yolk pattern b flank cell pattern, both shown in false color representing image intensities scaled between 0–1, indicated by the colorbar. c Box plot of pattern wavelength (λ) parameter with estimated medians of 0.66 and 0.60 μm measured from network segmented binary cell images of yolk and flank regions computed over 300 yolk and 293 flank cells, respectively. d Box plots of yolk and flank cell population mean microridge branch lengths (<Bl>) per cell yielding median values of 1.68 μm and 1.60 μm, respectively quantified from their skeletonized microridge branches.

Acknowledgments
This image is the copyrighted work of the attributed author or publisher, and ZFIN has permission only to display this image to its users. Additional permissions should be obtained from the applicable author or publisher of the image. Full text @ NPJ Syst Biol Appl