IMAGE

Fig. 6

ID
ZDB-IMAGE-230605-31
Source
Figures for Bhavna et al., 2023
Image
Figure Caption

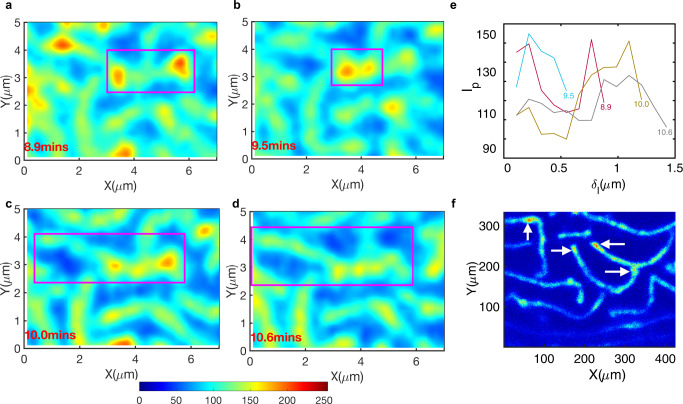
Fig. 6 Actin clusters within the microridges exhibit positional fluctuations.

ad The raw image intensity (in false color) of a representative microridge indicated the presence of actin clusters traversing along the microridge lengths across time frames. e Microridge tracking allowed extraction of a one-dimensional intensity profile along the same microridge at each timepoint. Each line color indicates the intensity profile, labeled by the time in minutes, showing the intensity fluctuations within the microridges. High-intensity peaks oscillate in position along microridge lengths. f A high-resolution STED imaged with lateral pixel size 0.022 μm in x and y and z-depth of 0.22 μm confirmed the clustered intensity spots within the microridges labeled with Utr-gfp.

Acknowledgments
This image is the copyrighted work of the attributed author or publisher, and ZFIN has permission only to display this image to its users. Additional permissions should be obtained from the applicable author or publisher of the image. Full text @ NPJ Syst Biol Appl