FIGURE

Fig. 3

ID
ZDB-FIG-230605-28
Publication
Bhavna et al., 2023 - A deep learning framework for quantitative analysis of actin microridges
Other Figures
All Figure Page
Back to All Figure Page
Fig. 3

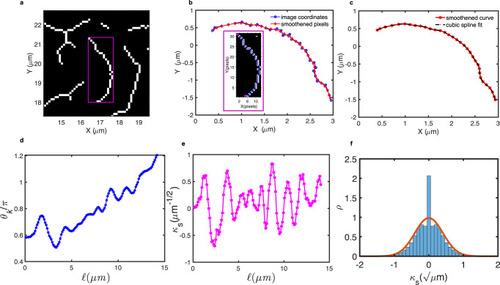
Estimation of persistence length for in vivo microridges.

a A magenta box demarcates the 2D sub-image of a skeletonized microridge branch for estimation of Lp. b Microridge skeleton contours (blue) were smoothened using a Gaussian fit (red curve). The inset shows a microridge skeleton (blue line) with the endpoints of the contour (magenta) used to obtain the boundary trace that returned the discrete x–y coordinates. c A cubic spline interpolation on the Gaussian smoothened microridge trace contours preserved the sequence of points to give several intermediate points. d Tangent angle (θk) along the length () of the microridge. e Rescaled κs along the length () of the microridge contour. f Distribution of κs of microridges from 1052 cells (293, 1084, and 125 from the flank, yolk, and head, respectively) fitted to a Gaussian distribution (red line trace), whose variance gives an estimate of the effective persistence length (Lp) as ~6.1 μm.

Expression Data

Expression Detail
Antibody Labeling
Phenotype Data

Phenotype Detail
Acknowledgments
This image is the copyrighted work of the attributed author or publisher, and ZFIN has permission only to display this image to its users. Additional permissions should be obtained from the applicable author or publisher of the image. Full text @ NPJ Syst Biol Appl