|
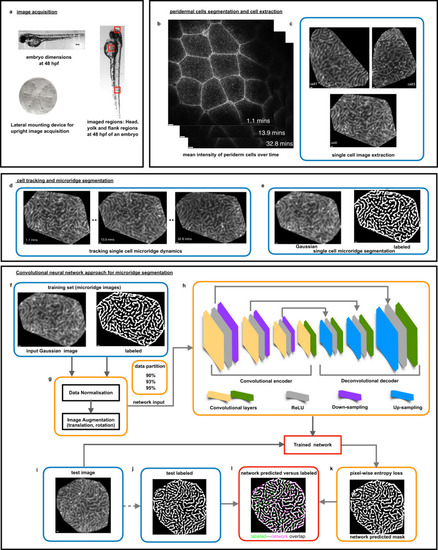
Live imaging, image processing pipeline for a neural network approach for microridge segmentation. a Zebrafish embryo dimensions were measured at 48 hpf and a custom-built embryo mounting device was designed for live image acquisition of one lateral side of the head, yolk, and flank embryo regions. b Mean intensity of the filtered periderm cell slices at all time points. c Membrane segmentation steps lead to demarcated cell boundaries and single-cell extraction. d Nearest centroid distance-based cell tracking allowed following each cell’s microridge dynamics. e Fully-automated custom-built microridge segmentation algorithm formed the labeled set for the deep learning segmentation strategy (Supplementary Fig. 1, Methods). f Convolutional neural network for microridge segmentation. The training set consisted of pairs of extracted cell patterns and their binarized images, illustrated in (b, e). g Prior to training, data normalization and data augmentation steps were implemented. Data were randomly partitioned into 90, 93, and 95% of the total set and various combinations of hyperparameters are trialed in the training process. h The convolutional encoder-decoder architecture consisting of a convolutional encoder and decoder layers (yellow and green), ReLU layers (gray), downsampling (purple), and upsampling layers (blue) yielded a trained network for each set of hyperparameters. i, j The network accuracy was assessed on the remaining test dataset (10, 7, and 5%, respectively) by pixel-wise comparison of network predicted and labeled outputs. k Trained network predictions on test data using pixel-wise entropy loss. l Labeled versus network-predicted outputs for assessing the network performance. (Scale bars indicate 1 pixel as 0.1977 μm in b–e and after image re-sizing for CNN to be 0.098 μm in f–k).
|