
- Title
-
Betaglycan promoter activity is differentially regulated during myogenesis in zebrafish embryo somites
- Authors
- Ramírez-Vidal, L., Molina-Villa, T., Mendoza, V., Peralta-Álvarez, C.A., Poot-Hernández, A.C., Dotov, D., López-Casillas, F.
- Source
- Full text @ Dev. Dyn.

Zebrafish Tgfbr3 gene map, exon 1 assignment and promoter sequence and activity. (A) The 16 Tgfbr3 exons are shown as black numbered rectangles on the line representing of the 300 000 bp in Danio rerio chromosome 6 containing the Tgfbr3 gene. The location of the testis-specific bromodomain gene (BRDT), transcribed from the opposite strand, is indicated. The position of the bacterial artificial chromosome (BAC) DKEY-197A14 and its zoomed-in ApaLI-ApaLI fragment containing the BG promoter are shown. Positions of primers 3.20, 3.13, and 3.15, located in exons 1, 5, and 9, respectively, are indicated by arrowheads. (B) Zebrafish Tgfbr3 promoter nucleotide sequence. The nucleotide sequence of the ApaLI-ApaLI fragment containing the Tgfbr3 promoter and first exon is shown. Positive ascending numbers on the right are from upstream ApaLI to downstream ApaLI sites. Negative descending numbers on the left are upstream from the sequences assigned as exon 1 (bold italics); nucleotides belonging to following intron 1 are shown in lower case letters. Position of primer 3.20 is indicated by dotted underline. Relevant responsive elements identified by Mat Inspector are underlined and named. Position of relevant restriction sites are indicated with their names above the sequence. (C) The RT-PCR products obtained with primers 3.20 to 3.13 (lane 1) and primers 3.20 to 3.15 (lane 2) are separated, along with 100-bp molecular markers ladder (lane M), by electrophoresis in an agarose gel. (D) The graph shows the beta-galactosidase-normalized luciferase activity obtained upon transfection of ZF4 fibroblasts with the promoter-less pGL3-basic plasmid or its derivate, p3.2tgfbr3:luc, which contains the ApaLI-BsaJI 3260 bp fragment. |
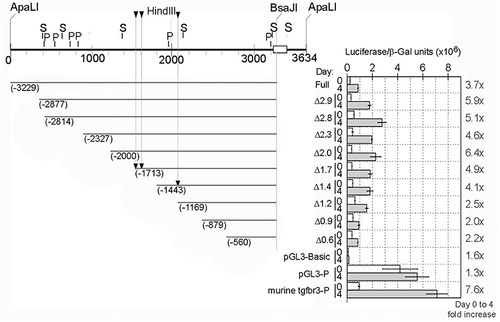
Zebrafish Tgfbr3 promoter activity increases during myogenic differentiation. C2C12 myoblasts were transfected with the full-length zebrafish Tgfbr3 promoter reporter construct p3.2tgfbr3:luc (full) or its 5′ truncated deletion mutants (indicated as Δ, with the kbp remaining in the plasmid), or with the murine BG promoter, or the pGL3 basic or pGL3 promoter negative or positive control vectors. Each one of these plasmids were co-transfected with a constant amount of a beta-galactosidase constitutive reporter. The cells were subjected to differentiation conditions and luciferase and galactosidase activities were determined. The beta-galactosidase-normalized luciferase activities obtained before (day 0) or after 4 days of differentiation are shown in the graph. The ratio of the normalized luciferase activity at day 4 over day 0 is indicated on the right margin of the graph as fold increase. Positions of the discussed myogenic responsive elements (arrowheads) and putative binding sites for Sox6 (S) and Prdm1a (P) are indicated. |
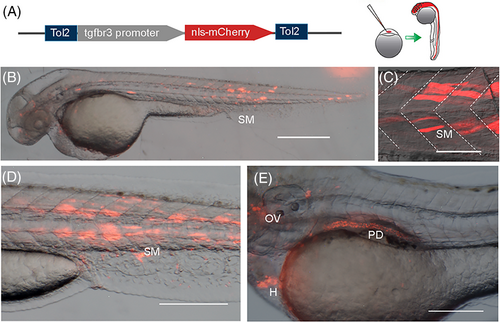
tgfbr3 promoter drives reporter expression during embryonic development. (A) p3.2tgfbr3:nls-mCherry:polyA reporter plasmid was injected in single cell zebrafish embryos, resulting in the mCherry mosaic expression at later stages. (B, C) 48 hpf embryos display mCherry in the head and skeletal muscle cells (SM) in somites resembling the aspect of superficial slow muscle fibers. (D, E) 72 hpf zebrafish embryos with reporter expression in skeletal muscle (SM), otic vesicle (OV), pronephric duct (PD), and heart (H). All images were acquired in a stereoscopic microscope Nikon SM1500. Scale bars: 400 μm in (B); 50 μm in (C, D); and 200 μm in (E). |

mCherry expression begins just before somite formation. (A, B) mCherry fluorescence (shown in yellow) in 2 hpf zebrafish zygotes obtained from a wild-type fish crossed with a transgenic female (panel A) or transgenic male (panel B). (C-H) zygotic mCherry expression in zebrafish embryos obtained from crosses of transgenic males and wild-type females starts at 10 hpf (panel C). By the 14 hpf (panel D), mCherry is observed in the eye (E) and mesodermal tissue including the somites. At later stages (panels E-H), mCherry expression is clearly observed in the trunk superficial skeletal muscle (SSM), heart (H), pectoral fin (PF), otic vesicle (OV), pronephric duct (PD), jaw (J), and non-identified cells from the eye and brain (B). Inset H′ shows the reporter expression in the OV and PF. Inset H" shows mCherry in skeletal mononuclear muscle cells at the level of somites 14 to 16. Scale bars 200 μm. |

Tg(tgfbr3:nls-mCherry) recapitulates tgfbr3 expression in skeletal muscle linage. (A-F) Lateral views of whole mounted embryos immunostained for Tgfbr3 (panels D-F) or mCherry protein (panel B); in panels A and C, the reporter mCherry fluorescence is shown. Panels D to F show Tgfbr3 protein expression in heart (H), otic vesicle (OV), eye (E), and skeletal muscle (SM). At 72 hpf, mCherry fluorescence and Tgfbr3 are higher in the posterior trunk somites (double arrowhead in C and F, respectively). Panels A to C show that mCherry expression matches with the co-receptor immunodetection at the indicated structures and time points. (H-J') The expression of Tgfbr3 protein (cyan) and mCherry (yellow) detected by fluorescent immunohistochemistry on transversal sections from the embryo regions and hpf indicated in the cartoon shown in panel G. White arrowheads indicate deep muscle fiber cells and white arrows show superficial muscle cells with mCherry and protein expression in the somitic skeletal muscle. The insets also show the expression of Tgfbr3 and mCherry protein in skeletal muscle cells, Hoechst staining all the nuclei (light gray). Notochord (N) and pronephric duct (PD) position and Tgfbr3 expression are also indicated. Scale bars 50 μm. |
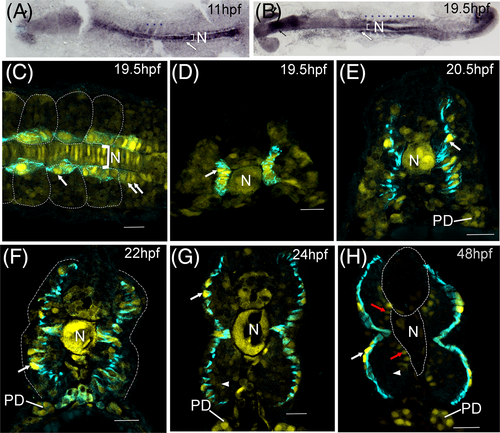
tgfbr3 promoter is upregulated in slow muscle and marks adaxial cells during their radial migration. (A, B) Immunohistochemistry for mCherry in flat mounted transgenic zebrafish embryos. High mCherry expression is detected in the notochord (N), in somitic mesoderm (indicated by blue asterisks) with higher signal in adaxial cells (white arrows) from presomitic and somitic mesoderm at 3 somite (11 hpf) and 19 somite stages (19.5 hpf). Expression is also observed in the eye (black arrowhead) and head (black arrow). (C-H) immunofluorescent staining of mCherry (yellow) and F59 (cyan). Dorsal view (panel C) of an embryo at 19.5 hpf (somites 16-19). Adaxial cells were labeled with F59 (cyan), mCherry is observed with higher fluorescence in the nuclei of adaxial cells from the somitic mesoderm (white arrow) and adaxial cells from presomitic mesoderm (double white arrows). Cells in the notochord (N) express high levels of mCherry. Transverse sections (panels D-H) in the caudal trunk (somites 14-17) show mCherry in the nuclei of adaxial cells (white arrows), which are revealed by the F59 staining (cyan). This monoclonal antibody marks the adaxial cells during their radial migration from 19.5 to 24 hpf (panels D-G) all the way to the somite surface where they become slow fibers (panel H). mCherry expression in notochord (N) and somitic fast muscle decreases gradually (white arrowheads in panels G and H), except in the fast fibers in contact with the notochord and neural tube (red arrows), while in the nuclei of superficial slow muscle fibers the mCherry expression increases (white arrows). The expression in pronephric ducts (PD) increases as development proceeds. In dorsal views, embryos are oriented with head to the left. Scale bars, 20 μm. |

tgfbr3 promoter has higher activity in slow muscle fibers of the posterior trunk somites. (A) The linear regression shows an increase in the normalized mCherry fluorescence intensity with respect to somite location. Each point in the plot represents the value obtained for single nuclei after normalizing with Hoechst staining as described in the text. Intensity fluorescence from eight nuclei were measure per somite, in eight different embryos at 72 hpf. Individual slopes are color-coded, and the overall regression is in black. (B) Representative image of the A-P gradient expression gradient in 72 hpf Tg(tgfbr3:nls-mCherry) embryo. |

Histone 3 epigenetic markers around tgbr3 exon 1 and gene expression analysis of components of the TGFβ canonical pathway. (A, B) Visualization of heterochromatin H3K4me1 and H3K4me3 marks over zebrafish betaglycan locus indicates strong H3K4me3 signals around the Ensembl predicted primary transcript. (C) Expression of genes encoding components of TGFβ canonical pathway during the indicated zebrafish developmental stages. Data were obtained from raw data repositories (Expression Atlas https://www.ebi.ac.uk/gxa/experiments/E-ERAD-475/Results) as described in the methods. |