
Image
|
Figure Caption
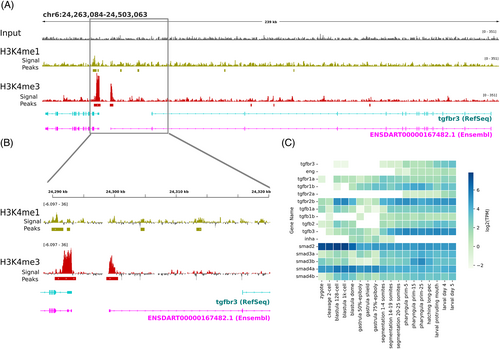
Fig. 8 Histone 3 epigenetic markers around tgbr3 exon 1 and gene expression analysis of components of the TGFβ canonical pathway. (A, B) Visualization of heterochromatin H3K4me1 and H3K4me3 marks over zebrafish betaglycan locus indicates strong H3K4me3 signals around the Ensembl predicted primary transcript. (C) Expression of genes encoding components of TGFβ canonical pathway during the indicated zebrafish developmental stages. Data were obtained from raw data repositories (Expression Atlas https://www.ebi.ac.uk/gxa/experiments/E-ERAD-475/Results) as described in the methods.
Acknowledgments
This image is the copyrighted work of the attributed author or publisher, and
ZFIN has permission only to display this image to its users.
Additional permissions should be obtained from the applicable author or publisher of the image.
Full text @ Dev. Dyn.