
- Title
-
Expanding Transition Metal-Mediated Bioorthogonal Decaging to Include C-C Bond Cleavage Reactions
- Authors
- Dal Forno, G.M., Latocheski, E., Beatriz Machado, A., Becher, J., Dunsmore, L., St John, A.L., Oliveira, B.L., Navo, C.D., Jiménez-Osés, G., Fior, R., Domingos, J.B., Bernardes, G.J.L.
- Source
- Full text @ J. Am. Chem. Soc.
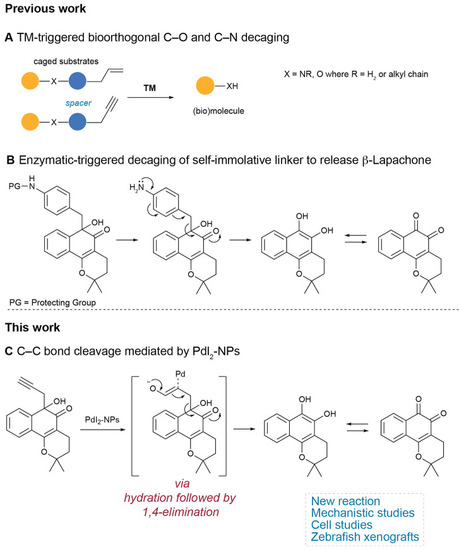
Palladium-mediated bioorthogonal bond cleavage strategies. (A) Palladium-mediated N/O-deallylation and depropargylation reactions for the activation of masked small molecules, proteins, and bioconjugates. (B) Specific enzymatic trigger, an acid-promoted, self-immolative C–C bond-cleaving 1,6-elimination mechanism releases β-lapachone.30 (C) This work, the decaging of the prodrug propargyl β-lapachone, through a palladium(II) nanoparticles-mediated C–C bond cleavage. |
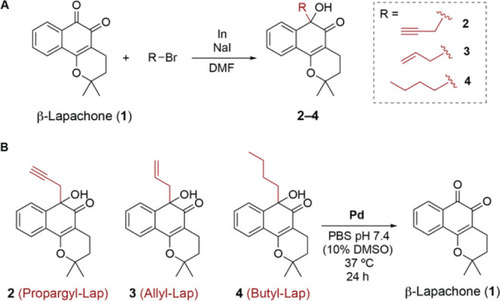
(A) Synthesis of β-Lap prodrugs ( |
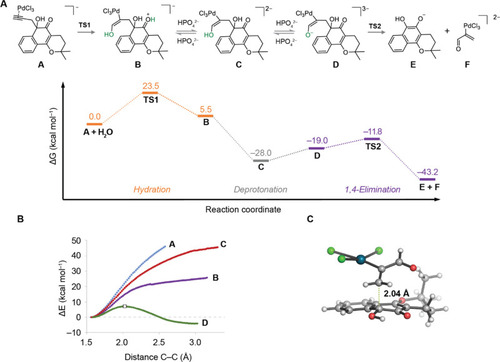
(A) Minimum energy profile (kcal mol–1) calculated with PCM(H2O)/ωB97x-D/6-311+G(2d,p) +LanL2DZ(Pd)//PCM(H2O)/M06-2X/6-31+G(d,p)+LanL2DZ(Pd) for the first turnover of the depropargylation reaction catalyzed by [PdCl4]2– in water. (B) PES calculated at the same theory level for the elimination of intermediates A (blue), B (purple), C (red), and D (green). All the scans were started from the lowest energy ground state conformer for each derivative. Only the PES for D displayed a maximum corresponding to the elimination reaction (white square), whereas no maximum was detected for the other intermediates. (C) Geometry of the lowest-energy calculated decaging transition state (TS2) Interatomic distances are given in angstroms. C–C breaking bonds are shown as dotted green lines. |

Toxicity of Propargyl-Lap (2) compared to β-lapachone for cancer cell lines measured by CellTiter Blue assay. (A) SKBR3 cell viability for 72 h. (B) Cell viability of SKBR3 cells after treatment with Propargyl-Lap (2) and subsequent decaging efficiency upon treatment with Pd(0)-NPs or PdI2-NPs, after 72 h (C) MOLM13 cell viability for 48 h. (D) Cell viability of MOLM13 cells after treatment with Propargyl-Lap (2) and subsequent decaging efficiency upon treatment with PdI2-NPs, after 48 h. Cell viability was determined by CellTiter Blue assay. The statistical significance: **P ≤ 0.01, ***P ≤ 0.001, and ****P ≤ 0.0001. Each experiment was performed in technical triplicates and two biological experiments. Error bars represent the standard error of the mean. Cells were treated with increasing concentrations of 2 and β-Lap during 48 h, after which the cell viability was determined using the CellTiter Blue assay. IC50 values were calculated from the generated eight-point semilog dose–response curves. |
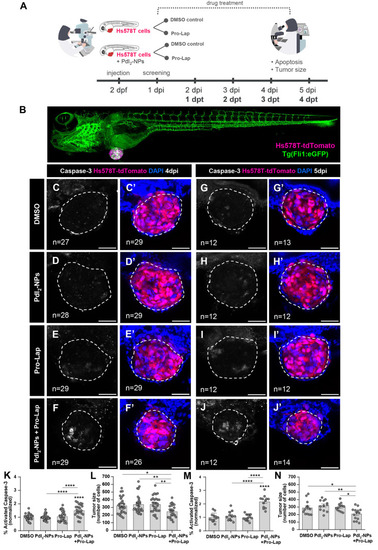
PdI2-NPs-mediated Propargyl-Lap decaging in zebrafish xenografts. (A) Experimental design: Hs578T-tdTomato TNBC cells were injected either alone or together with the PdI2-NPs (5 μM) into the PVS of 2 days post fertilization zebrafish embryos. At 24 hpi, xenografts were randomly distributed into two treatment groups: DMSO (control) and Propargyl-Lap, with daily E3/drug renewal. At 4 and 5 dpi, corresponding to 3 dpt and 4 dpt, xenografts were fixed and analyzed for apoptosis and the tumor size was quantified. (B) Representative low magnification of a Hs578T zebrafish xenograft injected in a Tg(Fli:eGFP) background. At 4 dpi (C–F’) and 5 dpi (G–J’), the xenografts were fixed, subjected to immunofluorescence, and later imaged by confocal microscopy (DAPI in blue, Hs578T-tdTomato in pink, and activated caspase-3 in white). Apoptosis [activated caspase 3, fold induction normalized to DMSO controls: (K,M); DMSO vs PdI2-NPs + Pro-Lap, 4 dpi (C vs F) ****P < 0.0001, 5 dpi (G vs J) ****P < 0.0001; PdI2-NPs vs PdI2-NPs + Pro-Lap, 4 dpi (D vs F) ****P < 0.0001, 5 dpi (H vs J) ****P < 0.0001; Propargyl-Lap vs PdI2-NPs + Propargyl-Lap, 4 dpi (E vs F) ****P < 0.0001, 5 dpi (I vs J) ****P < 0.0001] and tumor size [n° of tumor cells: (L,N); DMSO vs PdI2-NPs + Pro-Lap, 4 dpi (C’ vs F’) *P = 0.0274, 5 dpi (G’ vs J’) *P = 0.0407; PdI2-NPs vs PdI2-NPs + Pro-Lap, 4 dpi (D’ vs F’) **P = 0.0057, 5 dpi (H’ vs J’) **P = 0.003; Propargyl-Lap vs PdI2-NPs + Propargyl-Lap, 4 dpi (E’ vs F’) **P = 0.0049, 5 dpi (I’ vs J’) *P = 0.0222] were analyzed and quantified. Graphs are presented as average ± standard error of the mean. Results are from two independent experiments at 4 dpi and from one experiment at 5 dpi. The number of xenografts analyzed is indicated in the representative images, and each dot in the graphs represents one zebrafish xenograft. Statistical analysis was performed using an ANOVA test. Statistical results: ns > 0.05, *P ≤ 0.05, **P ≤ 0.01, ***P ≤ 0.001, and ****P ≤ 0.0001. All images are anterior to the left, posterior to right, dorsal up, and ventral down. Scale bar: 50 μm. PdI2-NPs—palladium (II) iodide nanoparticles; Pro-Lap—Propargyl-Lap. |