
Fig. 5
- ID
- ZDB-FIG-230925-13
- Publication
- Dal Forno et al., 2023 - Expanding Transition Metal-Mediated Bioorthogonal Decaging to Include C-C Bond Cleavage Reactions
- Other Figures
- All Figure Page
- Back to All Figure Page
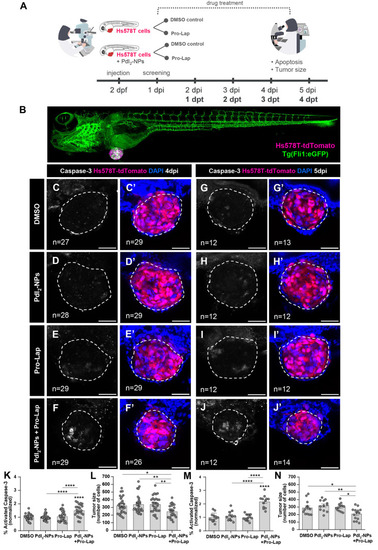
PdI2-NPs-mediated Propargyl-Lap decaging in zebrafish xenografts. (A) Experimental design: Hs578T-tdTomato TNBC cells were injected either alone or together with the PdI2-NPs (5 μM) into the PVS of 2 days post fertilization zebrafish embryos. At 24 hpi, xenografts were randomly distributed into two treatment groups: DMSO (control) and Propargyl-Lap, with daily E3/drug renewal. At 4 and 5 dpi, corresponding to 3 dpt and 4 dpt, xenografts were fixed and analyzed for apoptosis and the tumor size was quantified. (B) Representative low magnification of a Hs578T zebrafish xenograft injected in a Tg(Fli:eGFP) background. At 4 dpi (C–F’) and 5 dpi (G–J’), the xenografts were fixed, subjected to immunofluorescence, and later imaged by confocal microscopy (DAPI in blue, Hs578T-tdTomato in pink, and activated caspase-3 in white). Apoptosis [activated caspase 3, fold induction normalized to DMSO controls: (K,M); DMSO vs PdI2-NPs + Pro-Lap, 4 dpi (C vs F) ****P < 0.0001, 5 dpi (G vs J) ****P < 0.0001; PdI2-NPs vs PdI2-NPs + Pro-Lap, 4 dpi (D vs F) ****P < 0.0001, 5 dpi (H vs J) ****P < 0.0001; Propargyl-Lap vs PdI2-NPs + Propargyl-Lap, 4 dpi (E vs F) ****P < 0.0001, 5 dpi (I vs J) ****P < 0.0001] and tumor size [n° of tumor cells: (L,N); DMSO vs PdI2-NPs + Pro-Lap, 4 dpi (C’ vs F’) *P = 0.0274, 5 dpi (G’ vs J’) *P = 0.0407; PdI2-NPs vs PdI2-NPs + Pro-Lap, 4 dpi (D’ vs F’) **P = 0.0057, 5 dpi (H’ vs J’) **P = 0.003; Propargyl-Lap vs PdI2-NPs + Propargyl-Lap, 4 dpi (E’ vs F’) **P = 0.0049, 5 dpi (I’ vs J’) *P = 0.0222] were analyzed and quantified. Graphs are presented as average ± standard error of the mean. Results are from two independent experiments at 4 dpi and from one experiment at 5 dpi. The number of xenografts analyzed is indicated in the representative images, and each dot in the graphs represents one zebrafish xenograft. Statistical analysis was performed using an ANOVA test. Statistical results: ns > 0.05, *P ≤ 0.05, **P ≤ 0.01, ***P ≤ 0.001, and ****P ≤ 0.0001. All images are anterior to the left, posterior to right, dorsal up, and ventral down. Scale bar: 50 μm. PdI2-NPs—palladium (II) iodide nanoparticles; Pro-Lap—Propargyl-Lap. |