
|
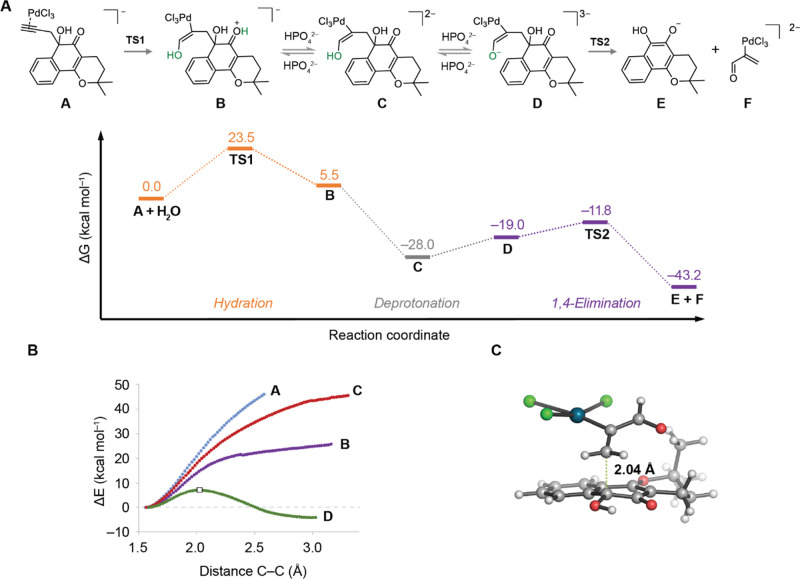
Fig. 3
(A) Minimum energy profile (kcal mol–1) calculated with PCM(H2O)/ωB97x-D/6-311+G(2d,p) +LanL2DZ(Pd)//PCM(H2O)/M06-2X/6-31+G(d,p)+LanL2DZ(Pd) for the first turnover of the depropargylation reaction catalyzed by [PdCl4]2– in water. (B) PES calculated at the same theory level for the elimination of intermediates A (blue), B (purple), C (red), and D (green). All the scans were started from the lowest energy ground state conformer for each derivative. Only the PES for D displayed a maximum corresponding to the elimination reaction (white square), whereas no maximum was detected for the other intermediates. (C) Geometry of the lowest-energy calculated decaging transition state (TS2) Interatomic distances are given in angstroms. C–C breaking bonds are shown as dotted green lines.