
|
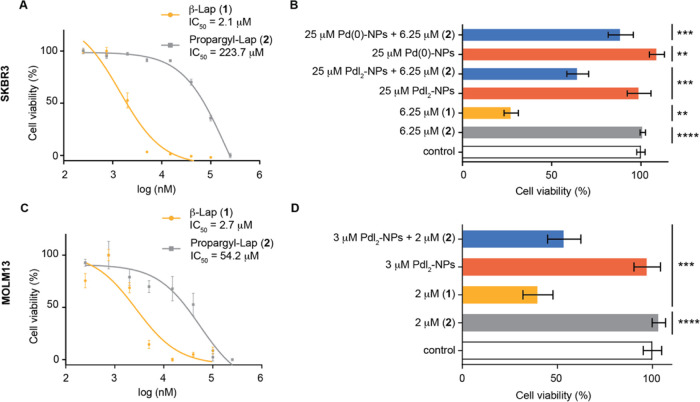
Fig. 4
Toxicity of Propargyl-Lap (2) compared to β-lapachone for cancer cell lines measured by CellTiter Blue assay. (A) SKBR3 cell viability for 72 h. (B) Cell viability of SKBR3 cells after treatment with Propargyl-Lap (2) and subsequent decaging efficiency upon treatment with Pd(0)-NPs or PdI2-NPs, after 72 h (C) MOLM13 cell viability for 48 h. (D) Cell viability of MOLM13 cells after treatment with Propargyl-Lap (2) and subsequent decaging efficiency upon treatment with PdI2-NPs, after 48 h. Cell viability was determined by CellTiter Blue assay. The statistical significance: **P ≤ 0.01, ***P ≤ 0.001, and ****P ≤ 0.0001. Each experiment was performed in technical triplicates and two biological experiments. Error bars represent the standard error of the mean. Cells were treated with increasing concentrations of 2 and β-Lap during 48 h, after which the cell viability was determined using the CellTiter Blue assay. IC50 values were calculated from the generated eight-point semilog dose–response curves.