
- Title
-
A Realistic Mixture of Persistent Organic Pollutants Affects Zebrafish Development, Behavior, and Specifically Eye Formation by Inhibiting the Condensin I Complex
- Authors
- Guerrero-Limón, G., Nivelle, R., Bich-Ngoc, N., Duy-Thanh, D., Muller, M.
- Source
- Full text @ Toxics

(A) Survival after 96 h of exposure to POP mixture. Survival decreases drastically at 386×. (B) Survival rate for POP mixtures and sub-mixtures at 10 dpf; ordinary one-way ANOVA and Dunnett’s multiple comparisons test. (C) Standard length of fish at 5 dpf. Data presented as median with higher and lower quartiles for each treatment. Asterisks (*) indicate when significant differences were found compared to control, hash sign (#) when differences were found relative to PFAA alone. (D) Fish measured at 10 dpf. Missing groups due to high mortality rates were not included. Kruskal–Wallis and Dunn’s multiple comparison tests, p ≤ 0.01 (**), p ≤ 0.001 (***), p ≤ 0.0001 (****). In short, PFAA < Total Mix < Cl = Br = Control. |

Examples of fish treated and untreated with the POP mix. Several malformations and size differences are striking. Pictures were cropped purposefully to enhance the differences found. (A) Fish treated with POP250x, red arrow pointing at the non-inflated swim bladder, blue arrow pointing at a pericardial edema. (B) Fish treated with POP125×. (C) Control, size bar = 1 mm. (D) Edema, as percentage of the population having this malformation. (E) Non-inflated swim bladder at 96 hpf, as percentage of population. Data presented as mean percentage of population having either malformation and standard deviation; ordinary one-way ANOVA and Tukey’s multiple comparison test, n = 100, p ≤ 0.001 (***). |

Example of eye malformation. (A) Untreated larva 4 dpf; (B) flattened eye with dents at both the upper and lower side of the eye and (C) eye hypoplasia of treated larvae with POP125×; (D) dose-based prevalence of eye malformation; (E) prevalence of eye malformation in larvae upon treatment with the different POP sub-mixtures. Data is presented as mean percentage of population having eye malformation and standard deviation; ordinary one-way ANOVA and Šidák’s multiple comparison test, n = 100, p ≤ 0.001 (***). Asterisks indicate when significant differences were found compared to control, hash sign (#) when differences were found compared to PFAA. (F) Prevalence of eye malformation present in fish exposed to POP125× relative to untreated individuals. Columns represent the effect of POP125 treatment in larvae previously injected with Mop53 (POP125× + injection) or not (POP125×). A Fisher’s exact test revealed the difference with a significance of p = 0.055 (*). |
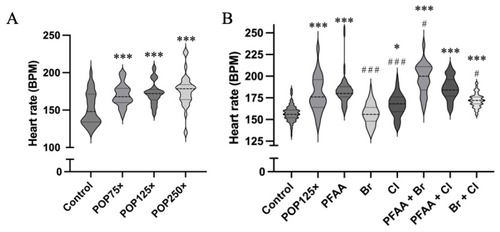
(A) Heart rate (BPM, beats per minute) of treated and untreated zebrafish using 3 different concentrations of the total POP mix. (B) Heart rate of all the fish exposed to the different treatments and measured at 4 dpf. Kruskal–Wallis test and Dunn’s multiple comparison, n = 30, p < 0.05 (*), p ≤ 0.001 (***). Asterisks indicate when significant differences were found compared to control, hash (#) sign when differences were found compared to PFAA. |

Actogram example of (A) swimming speed, (B) time spent active, and (C) distance travelled during 20 min of the tests, starting with 10 min dark phase followed by 10 min light. For comparison, control larvae are shown alongside POP125×-treated larvae. Two spikes can be appreciated when the fish entered a different phase. |
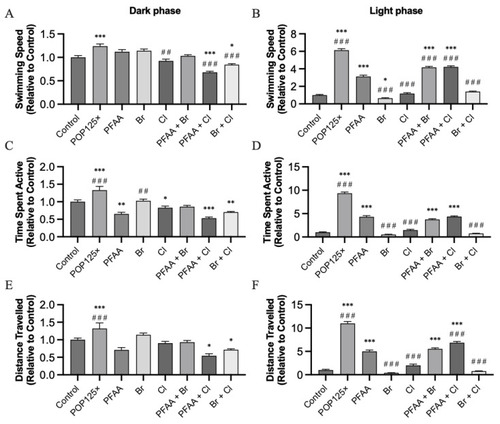
Behavior tests during the dark (left) and light (right) phases: swimming speed (A,B), time spent active (C,D), and distance travelled (E,F) for all treatments. All data were calculated excluding 50 s in the transition zone between light and dark phases, and the values were normalized relative to the corresponding controls for dark and light phases, n = 72, p < 0.05 (*), ≤ 0.01 (**), ≤ 0.001 (***). Asterisks (*) indicate when significant differences were found compared to control, hash (#) sign when differences were found against PFAA. |

Swimming speed (A,B), time spent active (C,D), and distance traveled (E,F) for all treatments. Left column, parameters during the dark phase, right column, parameters during the light phase. All results were calculated using 50 s during the transition zone between light and dark phases, n = 72, p ≤ 0.01 (**), ≤0.001 (***). Asterisks (*) indicate when significant differences were found compared to control, hash sign (#) when differences were found against PFAA. |

(A) Transgenic Tg(kdrl-mls:GFP) fish line treated with POP125×. (B) Plot with median values of the normalized fluorescence intensity of fish treated with different POP mixes at 96 hpf. There is a clear increasing trend. Kruskal–Wallis test and Dunn’s multiple comparison, n = 21, p < 0.05 (*), p < 0.01 (**), p < 0.001 (***). |

(A) Venn diagram comparing the lists of genes affected by POP1 or POP2 treatment. (B) Most highly and significantly regulated genes upon treatment with both POP total mix concentrations at 5 dpf. Log(fold change) and significance (adjusted p-value) are shown. Upregulated genes are in red, downregulated in green, while genes discussed in the text are highlighted in yellow. |
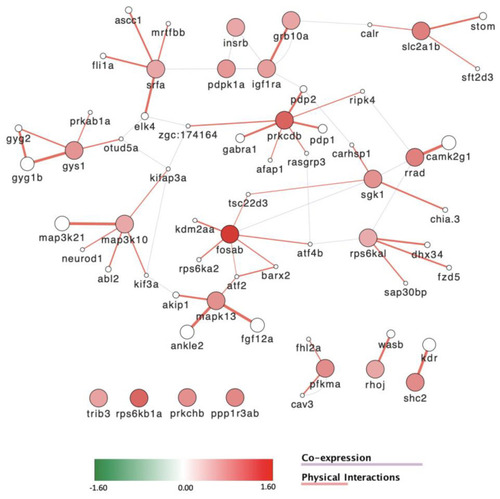
Differentially expressed genes involved in insulin signaling and response. These genes are all upregulated upon treatment with POP125× and distribute into specific co-expression and physically interacting modules. |

Differentially expressed genes that are involved in brain and eye development. These genes are all downregulated in zebrafish larvae treated with POP125× and form co-expression and physically interacting networks. |