
|
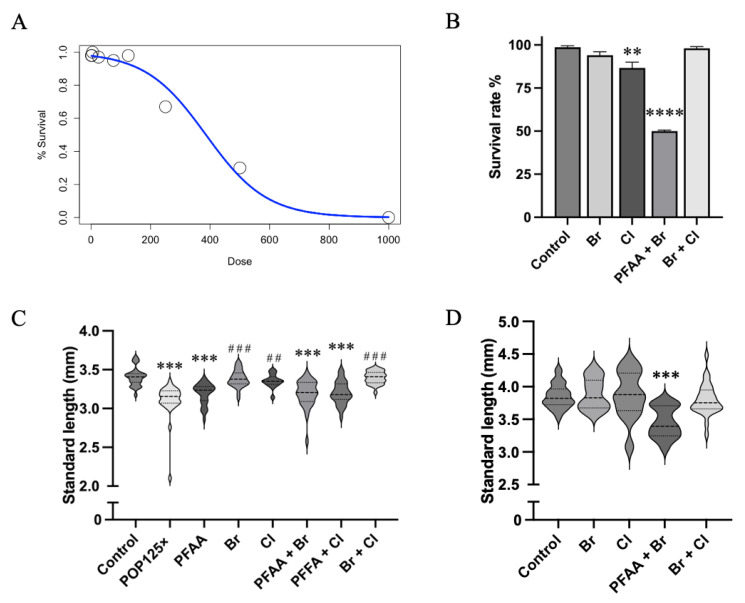
Figure 1
(A) Survival after 96 h of exposure to POP mixture. Survival decreases drastically at 386×. (B) Survival rate for POP mixtures and sub-mixtures at 10 dpf; ordinary one-way ANOVA and Dunnett’s multiple comparisons test. (C) Standard length of fish at 5 dpf. Data presented as median with higher and lower quartiles for each treatment. Asterisks (*) indicate when significant differences were found compared to control, hash sign (#) when differences were found relative to PFAA alone. (D) Fish measured at 10 dpf. Missing groups due to high mortality rates were not included. Kruskal–Wallis and Dunn’s multiple comparison tests, p ≤ 0.01 (**), p ≤ 0.001 (***), p ≤ 0.0001 (****). In short, PFAA < Total Mix < Cl = Br = Control.