
Image
|
Figure Caption
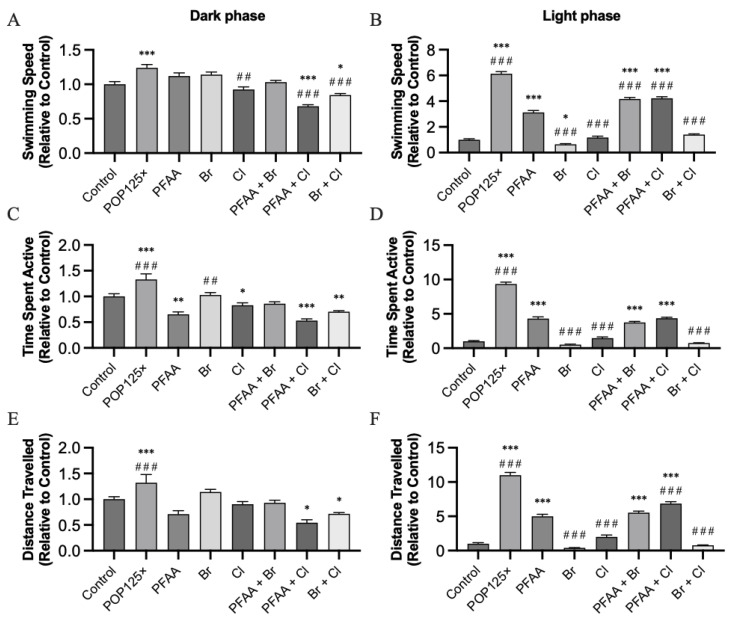
Figure 6
Behavior tests during the dark (left) and light (right) phases: swimming speed (A,B), time spent active (C,D), and distance travelled (E,F) for all treatments. All data were calculated excluding 50 s in the transition zone between light and dark phases, and the values were normalized relative to the corresponding controls for dark and light phases, n = 72, p < 0.05 (*), ≤ 0.01 (**), ≤ 0.001 (***). Asterisks (*) indicate when significant differences were found compared to control, hash (#) sign when differences were found against PFAA.
Acknowledgments
This image is the copyrighted work of the attributed author or publisher, and
ZFIN has permission only to display this image to its users.
Additional permissions should be obtained from the applicable author or publisher of the image.
Full text @ Toxics