
- Title
-
Severe neurometabolic phenotype in npc1-/- zebrafish with a C-terminal mutation
- Authors
- Quelle-Regaldie, A., Gandoy-Fieiras, N., Rodríguez-Villamayor, P., Maceiras, S., Losada, A.P., Folgueira, M., Cabezas-Sáinz, P., Barreiro-Iglesias, A., Villar-López, M., Quiroga-Berdeal, M.I., Sánchez, L., Sobrido, M.J.
- Source
- Full text @ Front. Mol. Neurosci.

Representation of the npc1 mutations in the NPC1 protein. 1–13 transmembrane domains were represented and also NTD (N-terminal domain), MLD (Middle luminal domain), SSD (sterol-sensing domain), and CTD (C-terminal domain). |
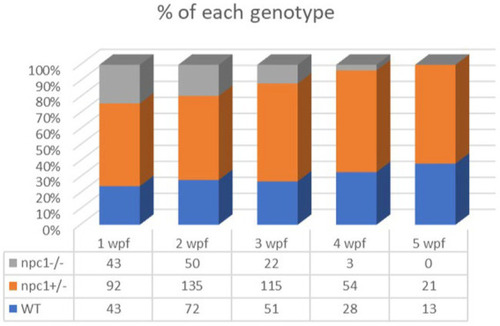
Representation of the percentage of surviving individuals per genotype from 1 to 5 wpf, showing a significant decrease in survival rate of npc1−/− larvae from 2 wpf. |

Shorter body length in npc1−/− from 2 wpf compared with wt and npc1+/− (value of p <0.05). We compared the fish that had the same age: the 3 groups of 2 wpf and the 3 groups of 3 wpf. Statistically significant data in the graphs is indicated with a red *. |
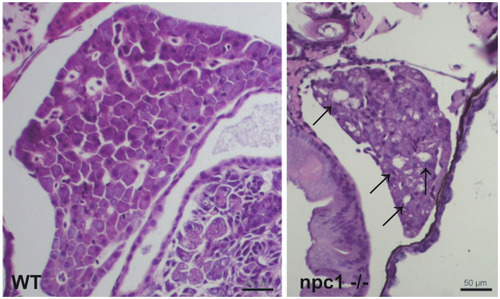
npc1−/− larvae of 3 wpf have moderate to severe vacuolation and ballooning of hepatocytes (indicated with arrows). Scale bars: 50 μm. |

Alterations of different organs in npc1 −/− and wild type larvae of 3 wpf. (A) Intestine and liver. In npc1 −/− vacuolation in some enterocytes (intestine: black arrows) and hepatocytes (liver: red arrows) can be observed. (B) Gray matter. In npc1 −/− vacuolation in the brain gray matter is indicated with red arrows. (C) Renal tubules. In npc1 −/− cytoplasmic vacuolation of renal tubule epithelium is observed, some of the vacuoles are marked with black arrows. |
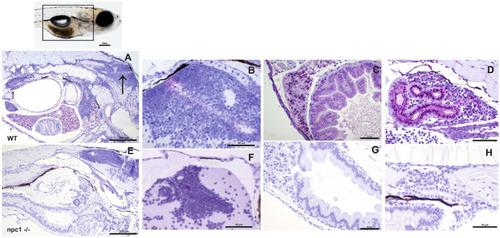
Immunohistochemical study at 3 wpf with anti-NPC1 antibody in wt (A–D) and npc1−/− individuals (E–H). The square in the top picture indicates the part of the body shown in (A,E). Wt fish (A) were anti-NPC1 positive (indicated by purple staining) in the central nervous system (A) (arrow) and (B), liver (C), intestine (C) and renal tubules (D) whereas npc1−/−larvae (E) showed no staining in central nervous system (F), liver (G), intestine (G) or renal tubules (H). Scale bars in (A,E) 200 μm. Scale bars in (B–D,F–H) 50 μm. |
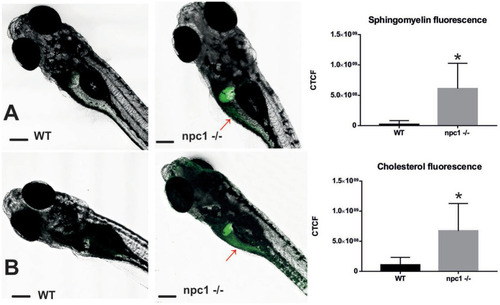
Both sphingomyelin (A) and cholesterol (B) produce aggregations mainly in the liver of the npc1−/− but also in the intestine (red arrows) at 2 wpf. CTCF test showed increased fluorescence in npc1−/− animals at 3 wpf for both sphingomyelin (A) and cholesterol (B) stainings (value of p < 0.001). Scale bars: 100 μm. Statistically significant data in the graphs is indicated with a *. |

(A) npc1−/− larvae have significant reduction in locomotion compared to npc1+/− and wt larvae at 3 wpf value of p = 0.0002. (B) Example of locomotion tracks are shown. The orange dot indicated the start position of the larvae. Green color indicated slow movements and black color regular movement. Statistically significant data in the graphs is indicated with a red *. |
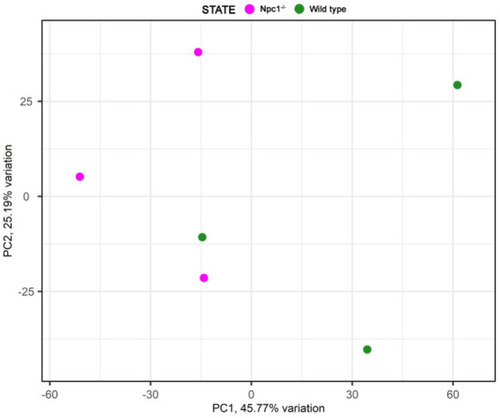
Principal component analysis of the RNAseq samples. |
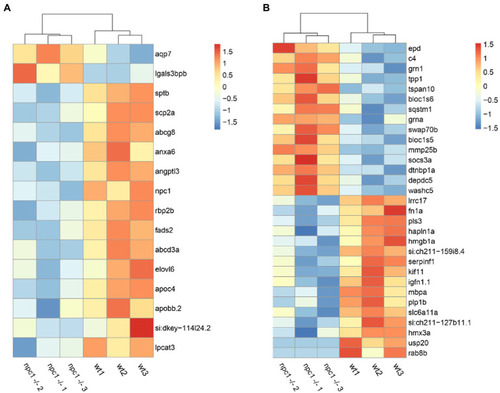
RNAseq analysis revealed differential expression between wt and npc1Δ56/ Δ56 (A) Genes involved in lipid synthesis and metabolism. (B) Genes related to Central Nervous system processes. Heatmap shows the fold change of selected genes which have significant up- (positive values, orange) or down-regulation (negative values, blue). |
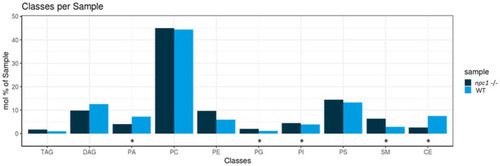
Lipidomic analysis of 10 different lipid classes: TAG (triacylglycerol), DAG (diacylglycerol), PA (phosphatidate), PC (Phosphatidylcholine), PE (phosphatidylethanolamine), PG (phosphatidylglycerol), PI (phosphatidylinositol), PS (phosphatidylserine), SM (sphingomyelin) and CE (cholesteryl esters) between wt (healthy) and npc1−/− (disease) revealed statistically significant percentage differences in PA (value of p = 0.036), PG (value of p = 0.0055), PI (value of p = 0.038), SM (value of p = 0.002), and CE (value of p = 0.02). Statistically significant data in the graphs is indicated with a *. |
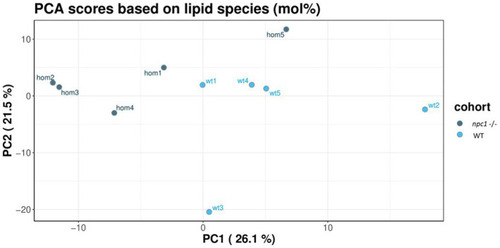
Principal component analysis of the lipidomic samples. |
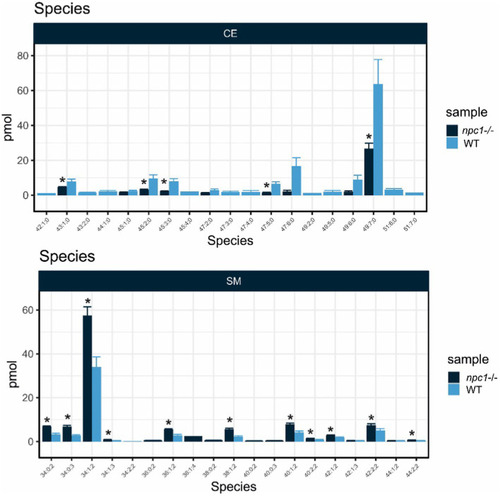
Lipid analysis showed reduction in most species of Cholesteryl Esters (CE) and increase of most species of Sphingomyelin (SM) in npc1Δ56/Δ56. Statistically significant data in the graphs is indicated with a *. |