
Image
|
Figure Caption
Figure 10
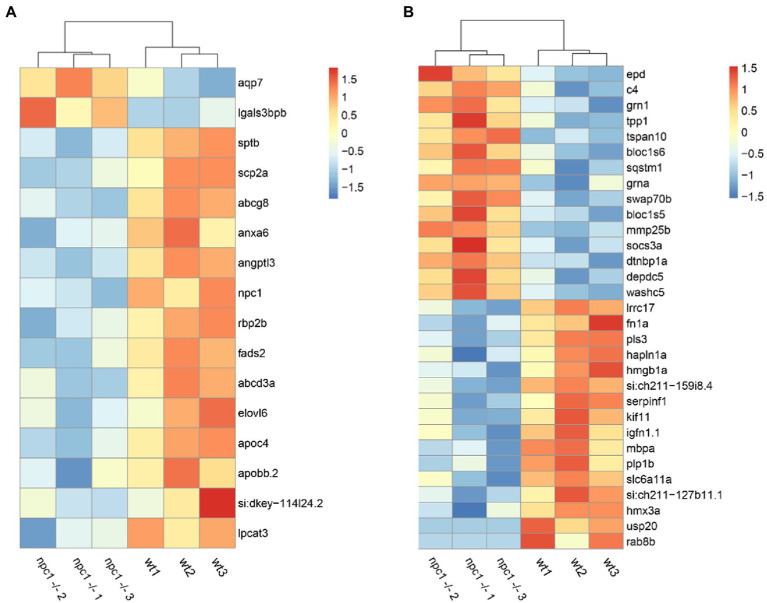
RNAseq analysis revealed differential expression between wt and npc1Δ56/ Δ56 (A) Genes involved in lipid synthesis and metabolism. (B) Genes related to Central Nervous system processes. Heatmap shows the fold change of selected genes which have significant up- (positive values, orange) or down-regulation (negative values, blue).
Acknowledgments
This image is the copyrighted work of the attributed author or publisher, and
ZFIN has permission only to display this image to its users.
Additional permissions should be obtained from the applicable author or publisher of the image.
Full text @ Front. Mol. Neurosci.