
Image
|
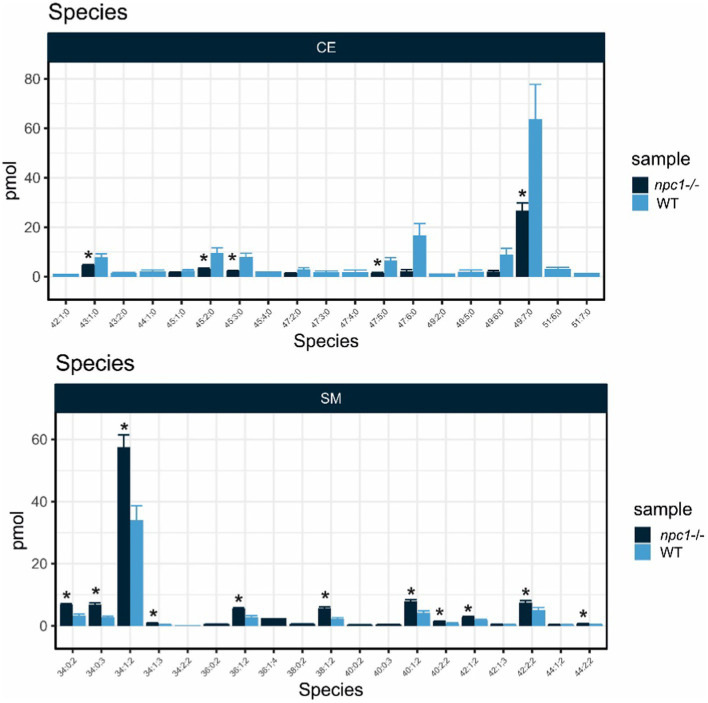
Figure Caption
Figure 13
Lipid analysis showed reduction in most species of Cholesteryl Esters (CE) and increase of most species of Sphingomyelin (SM) in npc1Δ56/Δ56. Statistically significant data in the graphs is indicated with a *.
Acknowledgments
This image is the copyrighted work of the attributed author or publisher, and
ZFIN has permission only to display this image to its users.
Additional permissions should be obtained from the applicable author or publisher of the image.
Full text @ Front. Mol. Neurosci.