
FIGURE
Figure 7
- ID
- ZDB-FIG-230406-7
- Publication
- Quelle-Regaldie et al., 2023 - Severe neurometabolic phenotype in npc1-/- zebrafish with a C-terminal mutation
- Other Figures
- All Figure Page
- Back to All Figure Page
Figure 7
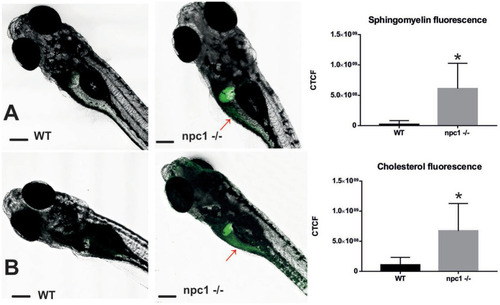
Both sphingomyelin (A) and cholesterol (B) produce aggregations mainly in the liver of the npc1−/− but also in the intestine (red arrows) at 2 wpf. CTCF test showed increased fluorescence in npc1−/− animals at 3 wpf for both sphingomyelin (A) and cholesterol (B) stainings (value of p < 0.001). Scale bars: 100 μm. Statistically significant data in the graphs is indicated with a *. |
Expression Data
Expression Detail
Antibody Labeling
Phenotype Data
| Fish: | |
|---|---|
| Observed In: | |
| Stage: | Days 21-29 |
Phenotype Detail
Acknowledgments
This image is the copyrighted work of the attributed author or publisher, and
ZFIN has permission only to display this image to its users.
Additional permissions should be obtained from the applicable author or publisher of the image.
Full text @ Front. Mol. Neurosci.