
- Title
-
Activated PI3K Delta Syndrome-1 mutations cause neutrophilia in zebrafish larvae
- Authors
- Elworthy, S., Rutherford, H.A., Prajsnar, T.K., Hamilton, N.M., Vogt, K., Renshaw, S.A., Condliffe, A.M.
- Source
- Full text @ Dis. Model. Mech.
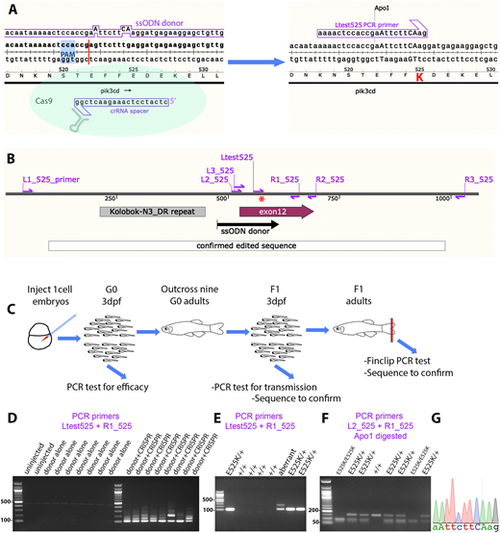
Homology-directed CRISPR-Cas9 knock-in of a pik3cdE525K allele. (A) Diagram illustrating the knock-in process. The CRISPR-Cas9 cleavage and knock-in is illustrated on the left and the resulting pik3cdE525K allele on the right. On the left, the single-strand oligonucleotide (ssODN) donor sequence and crRNA spacer sequence are positioned alongside the pik3cd DNA sequence and translated amino acid sequence, with the CRISPR-Cas9 protospacer adjacent motif (PAM) highlighted in blue and the cleavage site shown as a red line. On the right, mutated DNA bases are shown in upper case, the E525K coding change is highlighted in red, and the introduced ApoI cleavage site is indicated. The Ltest525 PCR primer is specific for the knock-in allele. (B) Map of the zebrafish pik3cdE525K locus. PCR primers are shown as magenta arrows; the mutation site is marked with a red asterisk; and positions are shown for the ssODN donor used for knock-in, the region confirmed by sequencing after knock-in, pik3cd exon 12 and a DNA repeat incompatible with PCR primer location. (C) Diagram illustrating the workflow for establishing the line with the pik3cdE525K allele. (D) Agarose electrophoresis gel with knock-in-specific test PCRs from 3 days post fertilisation (dpf) G0 embryos. All the embryos previously injected with CRISPR-Cas9 and ssODN donor produced the expected 103 bp amplicon and also lower electrophoretic mobility products. PCRs from uninjected embryos, or embryos injected with CRISPR-Cas9 alone, did not amplify. DNA size marker is a 100 bp ladder. (E) Agarose electrophoresis gel with knock-in-specific test PCRs from 3 dpf F1 embryos from an outcross of a G0 adult that had been injected with CRISPR-Cas9 and ssODN donor when an embryo. PCRs from embryos with the pik3cdE525K allele produced a 103 bp amplicon. A lower-mobility band indicates a putative aberrant knock-in event. DNA size marker is 100 bp ladder. (F) Agarose electrophoresis gel with Apo1-digested PCR amplicons from F2 embryos from a pik3cdE525K/+ in-cross. The pik3cdE52K5 allele introduces an Apo1 site, allowing pik3cdE525K/E525K, pik3cdE525K/+ and pik3cd+/+ genotypes to be distinguished. DNA size marker is 50 bp ladder. (G) Sanger sequencing trace from a PCR amplicon across the knock-in locus of a pik3cdE525K/E525K F2 adult. The mutated DNA bases are shown in upper case as in A. |

Homology-directed CRISPR-LbCpf1 knock-in of a pik3cdE1017K allele. (A) Sequence of crRNA oligonucleotide, showing 5′ and 3′ extensions beyond the minimal sequence of repeat tail and target binding spacer. (B) Diagram illustrating the knock-in process. The CRISPR-LbCpf1 cleavage and knock-in is illustrated on the left and the resulting pik3cdE1017K allele on the right. On the left, the ssODN donor sequence and crRNA spacer sequence are positioned alongside the pik3cd DNA sequence and translated amino acid sequence, with the CRISPR-LbCpf1 PAM highlighted in blue and the cleavage site shown as a red line. On the right, mutated DNA bases are shown in upper case, the E1017K coding change is highlighted in red, and the introduced ApoI cleavage site is indicated. The Ltest_1017 PCR primer is specific for the knock-in allele. (C) Map of the zebrafish pik3cdE1017K locus. PCR primers are shown as magenta arrows; the mutation site is marked with a red asterisk; and positions are shown for the ssODN donor used for knock-in, the region confirmed by sequencing after knock-in and pik3cd exon 23. (D) Agarose electrophoresis gel with knock-in-specific test PCRs from 3 dpf G0 embryos. All the embryos previously injected with CRISPR-LbCpf1 and ssODN donor produced the expected 113 bp amplicon and sometimes also lower electrophoretic mobility products. PCRs from uninjected embryos did not amplify. DNA size marker is 100 bp ladder. (E) Agarose electrophoresis gel with knock-in-specific test PCRs from 3 dpf F1 embryos from an outcross of a G0 adult that had been injected with CRISPR-LbCpf1 and ssODN donor when an embryo. A pik3cdE1017K/+ embryo produced the 113 bp amplicon; other embryos produced lower-mobility amplicons indicating aberrant knock-in events. DNA size marker is 100 bp ladder. (F) Agarose electrophoresis gel with PCRs spanning the knock-in locus to further test embryos that had given the expected 113 bp amplicon with test PCRs as in E. The pik3cdE1017K/+ embryo indicated in E gave the expected 332 bp amplicon, but some other embryos produced lower-mobility amplicons indicating aberrant knock-in events despite having given the expected 113 bp amplicon with test PCRs as in E. (G) Agarose electrophoresis gel with Apo1-digested PCR amplicons from F2 adults from a pik3cdE1017K/+ in-cross. The pik3cdE1017K allele introduces an Apo1 site, allowing pik3cdE1017K/E1017K, pik3cdE1017K/+ and pik3cd+/+ genotypes to be distinguished. DNA size marker is 100 bp ladder. (H) Sanger sequencing trace from a PCR amplicon across the knock-in locus of a pik3cdE1017K/E1017K F2 adult. The mutated DNA bases are shown in upper case as in B. |
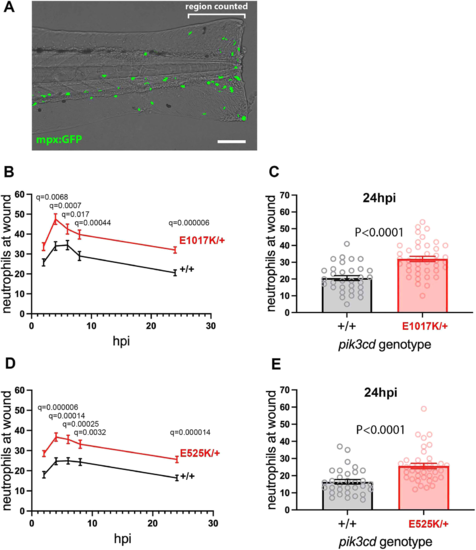
Neutrophilic inflammation following tail-fin injury of pik3cdE1017K/+ embryos and pik3cdE525K/+ embryos. (A) Composite brightfield and maximal projection of widefield fluorescent (shown in green) micrograph stack, illustrating the TgBAC(mpx:gfp)i114 3 dpf embryo tail-fin injury used to analyse inflammation response. Transection is through the tip of the notochord, and GFP marked neutrophils counted proximal to the circulatory loop. Scale bar: 100 µm. (B) Chart of the tail-fin injury inflammation time course for 72, 3 dpf embryos from a pik3cdE1017K/+ outcross. Successive neutrophil counts at the injury site are shown as the mean±s.e.m. for embryos subsequently genotyped as pik3cdE1017K/+ (red) or pik3cd+/+ (black). Multiple Mann–Whitney tests. (C) Chart with the same data as in B but showing the neutrophil counts for the individual embryos at the 24 h post injury (hpi) end point of the analysis. Mann–Whitney test. Data shown are from one experiment. A repeat experiment with 71 embryos showed the same effect (P<0.0001 at 24 hpi), as did a 36-embryo, 4 hpi time point, pilot experiment (P=0.001). (D) Chart of the tail-fin injury inflammation time course for 71, 3 dpf embryos from a pik3cdE525K/+ outcross. Successive neutrophil counts at the injury site are shown as the mean±s.e.m. for embryos subsequently genotyped as pik3cdE525K/+ (red) or pik3cd+/+ (black). Multiple Mann–Whitney tests. (E) Chart with the same data as in D but showing the neutrophil counts for the individual embryos at the 24 hpi end point of the analysis. Mann–Whitney test. Data shown are from one experiment. A repeat experiment with 96 embryos showed the same effect (P=0.0004 at 24 hpi). |
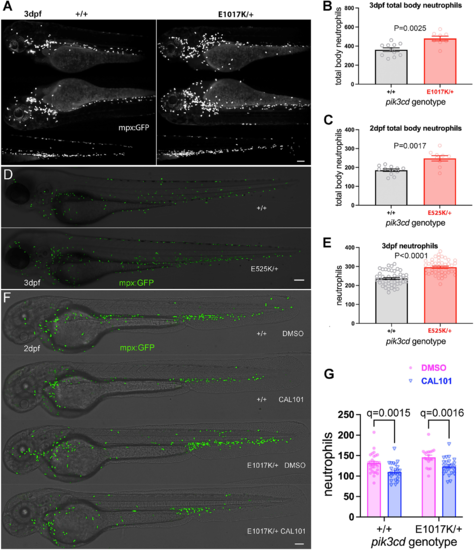
Effect on total body neutrophils from pik3cdE1017K/+ and pik3cdE525K/+ genotype and the PI3Kδ inhibitor CAL-101. (A) Light-sheet microscopy used to count total body TgBAC(mpx:gfp)i114 neutrophils of pik3cdE1017K/+ and pik3cd+/+ 3 dpf, sibling embryos. Upper panels show maximal-intensity projections for the three views used for each embryo. Scale bar: 100 µm. (B) Chart of total body neutrophils counted from light-sheet microscopy views as in A for 19 sibling 2 dpf pik3cdE1017K/+and pik3cd+/+ embryos. Bars show the mean±s.e.m., Mann–Whitney test. Data shown are from one experiment. (C) Chart of total body neutrophils counted from light-sheet microscopy views as in A, but for 21 pik3cdE525K/+and pik3cd+/+ 2 dpf sibling embryos. Bars show the mean±s.e.m., Mann–Whitney test. Data shown are from one experiment. (D) Composites of brightfield and the maximal-intensity projections of spinning disk confocal fluorescent (shown in green) micrograph stacks used to count TgBAC(mpx:gfp)i114 neutrophils in sibling pik3cdE525K/+ and pik3cd+/+ 3 dpf embryos. Scale bar: 100 µm. (E) Chart of neutrophils counted from single-sided maximal-intensity projections as in D for 96 sibling pik3cdE525K/+ and pik3cd+/+ 3 dpf embryos. Bars show the mean±s.e.m., Mann–Whitney test. Data shown are from one experiment. (F) Composites of brightfield and the maximal-intensity projections of spinning disk confocal fluorescent (shown in green) micrograph stacks used to count TgBAC(mpx:gfp)i114 neutrophils in sibling pik3cdE1017K/+ and pik3cd+/+ 2 dpf embryos exposed between 24 hpf and 48 hpf to either 25 µM CAL-101 in 1% DMSO or a 1% DMSO vehicle control. Scale bar: 100 µm. (G) Chart of neutrophils counted from single-sided maximal-intensity projections as in F for 95 sibling pik3cdE1017K/+ and pik3cd+/+ 2 dpf embryos exposed between 24 hpf and 48 hpf to either 25 µM CAL-101 or a DMSO vehicle control. Bars show the mean±s.e.m., multiple Mann–Whitney tests. Data shown are from one experiment. Two pilot experiments with CAL-101 also showed reduced neutrophils. |
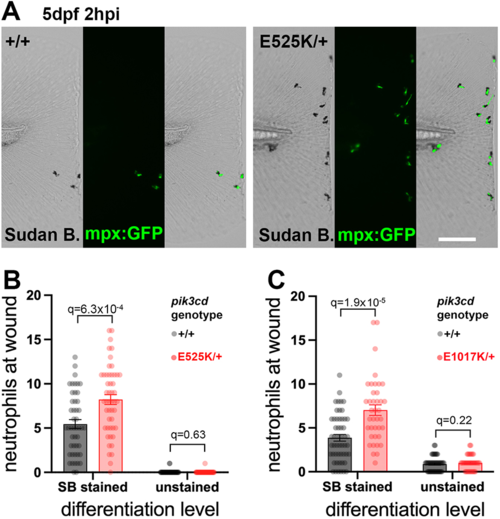
Sudan Black assessment of neutrophil differentiation at tail-fin injury site at 5 dpf. (A) Brightfield and maximal-intensity projection of widefield fluorescent micrographs of tail fins of Sudan Black (SB)-stained, 5 dpf, TgBAC(mpx:gfp)i114; pik3cdE525K/+and pik3cd+/+ sibling embryos fixed 2 hpi after transection of the tip of the tail fin. Scale bar: 100 µm. (B) Chart of neutrophil counts at tail-fin injury site, from 96 sibling 5 dpf, pik3cdE525K/+and pik3cd+/+ embryos as in A. Counts are shown both for Sudan Black-stained neutrophils and for unstained neutrophils marked by TgBAC(mpx:gfp)i114. Bars show the mean±s.e.m., multiple Mann–Whitney tests. Data shown are from one experiment. A pilot experiment with pik3cdE525K/+ also showed that TgBAC(mpx:gfp)i114-marked cells were almost all Sudan Black stained. (C) Chart of neutrophil counts at tail-fin injury site, from 92 sibling 5 dpf, pik3cdE1017K/+and pik3cd+/+ embryos. Counts are shown both for Sudan Black-stained neutrophils and for unstained neutrophils marked by TgBAC(mpx:gfp)i114. Bars show the mean±s.e.m., multiple Mann–Whitney tests. Data shown are from one experiment. |
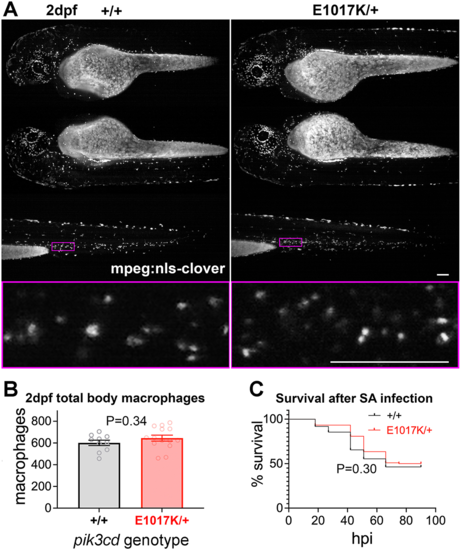
Total body macrophages in pik3cdE1017K/+ embryos and survival following S. aureus infection. (A) Light-sheet microscopy used to count total body Tg(mpeg1.1:NLS-clover)sh616 macrophages of pik3cdE1017K/+ and pik3cd+/+ 2 dpf, sibling embryos. Top three rows show maximal-intensity projections for the three views used for each embryo. The magenta border shows the region displayed in the bottom row as a single-slice view from the image stack at higher magnification as used for counting. Scale bars: 100µm. (B) Chart of total body macrophages counted from light-sheet microscopy views as in A for 24 sibling 2 dpf pik3cdE1017K/+and pik3cd+/+ embryos. Bars show the mean±s.e.m., Mann–Whitney test. Data shown are from one experiment. (C) Survival of 214 sibling pik3cdE1017K/+and pik3cd+/+ embryos following injection of 1500 colony-forming units of S. aureus (SA) into the circulation. Log-rank (Mantel–Cox) test. Data shown are from one experiment. A repeat experiment with 229 embryos showed similar results (P=0.99 between genotypes). |

Tail-fin regeneration in pik3cdE525K/+ embryos. (A) Brightfield micrographs used to measure tail-fin regeneration for pik3cdE525K/+ embryos and their pik3cd+/+ siblings at 5 dpf, 2 days post injury (dpi). Top row shows uninjured controls. Transection was through the tip of the notochord. The regenerated area is illustrated with cyan false colour. Scale bar: 100 µm. (B) Chart of tail-fin regenerated area from micrographs as in A for 96 embryos. Bars show the mean±s.e.m., Mann–Whitney test. Data shown are from one experiment. A similar experiment using 5 dpf, 3 dpi larvae also detected no effect. (C) Chart of tail-fin regenerated area for pik3cdE1017K/+ embryos and their pik3cd+/+ siblings at 5 dpf, 2 dpi. Measured from micrographs of 96 embryos. Bars show the mean±s.e.m., Mann–Whitney test. Data shown are from one experiment. (D) Maximal-intensity projections of spinning disk confocal fluorescent micrograph stacks of 3 dpf TgBAC(il1b:EGFP)sh445;pik3cdE1017K/+ embryos and their pik3cd+/+ siblings, fixed and stained 3 h after tail transection. Fluorescence channels are shown for GFP and for endogenous peroxidase activity stain with Cy5-tyramide to identify neutrophils. Scale bar: 100 µm. (E) Chart of neutrophil TgBAC(il1b:EGFP)sh445 fluorescence intensity for single neutrophils at the injury site from each of 96 3 dpf sibling pik3cdE1017K/+ and pik3cd+/+ larvae, fixed and stained 3 h after tail transection as in D. Bars show the mean±s.e.m., Mann–Whitney test. Data shown are from one experiment. |
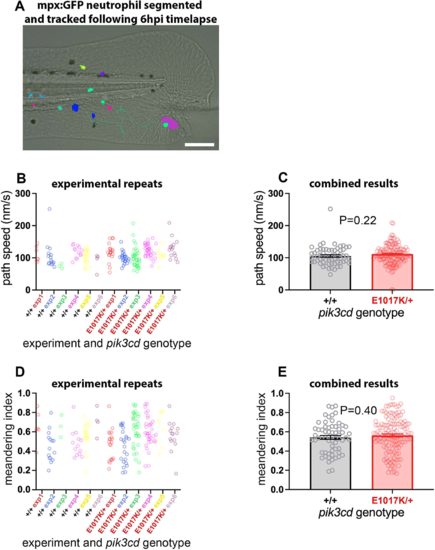
Neutrophil migration in pik3cdE1017K/+ embryos. (A) Illustrative example of the TgBAC(mpx:gfp)i114 tail-fin injury inflammation model used to track neutrophil migration at 3 dpf. Following a minor tail-fin injury and widefield time-lapse microscopy for 6 hpi, semi-automated segmentation and tracking with NIS Elements software determined migration paths to the injury site. Segmented TgBAC(mpx:gfp)i114 neutrophils are shown as false-coloured patches, and a migration track is shown as a green line, superimposed on a brightfield micrograph (taken at the start of the time-lapse sequence). Scale bar: 100 µm. (B) Chart of path speeds for tracked neutrophils from sibling pik3cdE1017K/+ and pik3cd+/+ embryos as in A. Data are shown for each of six experiments, each with eight or nine embryos. (C) Chart of pooled data from B. Bars show the mean±s.e.m., unpaired t-test with Welch's correction. (D) Chart of meandering index (displacement/path length) for the tracked neutrophils as in B. (E) Chart of pooled data from D. Bars show the mean±s.e.m., unpaired t-test with Welch's correction. |