
|
Fig. 6
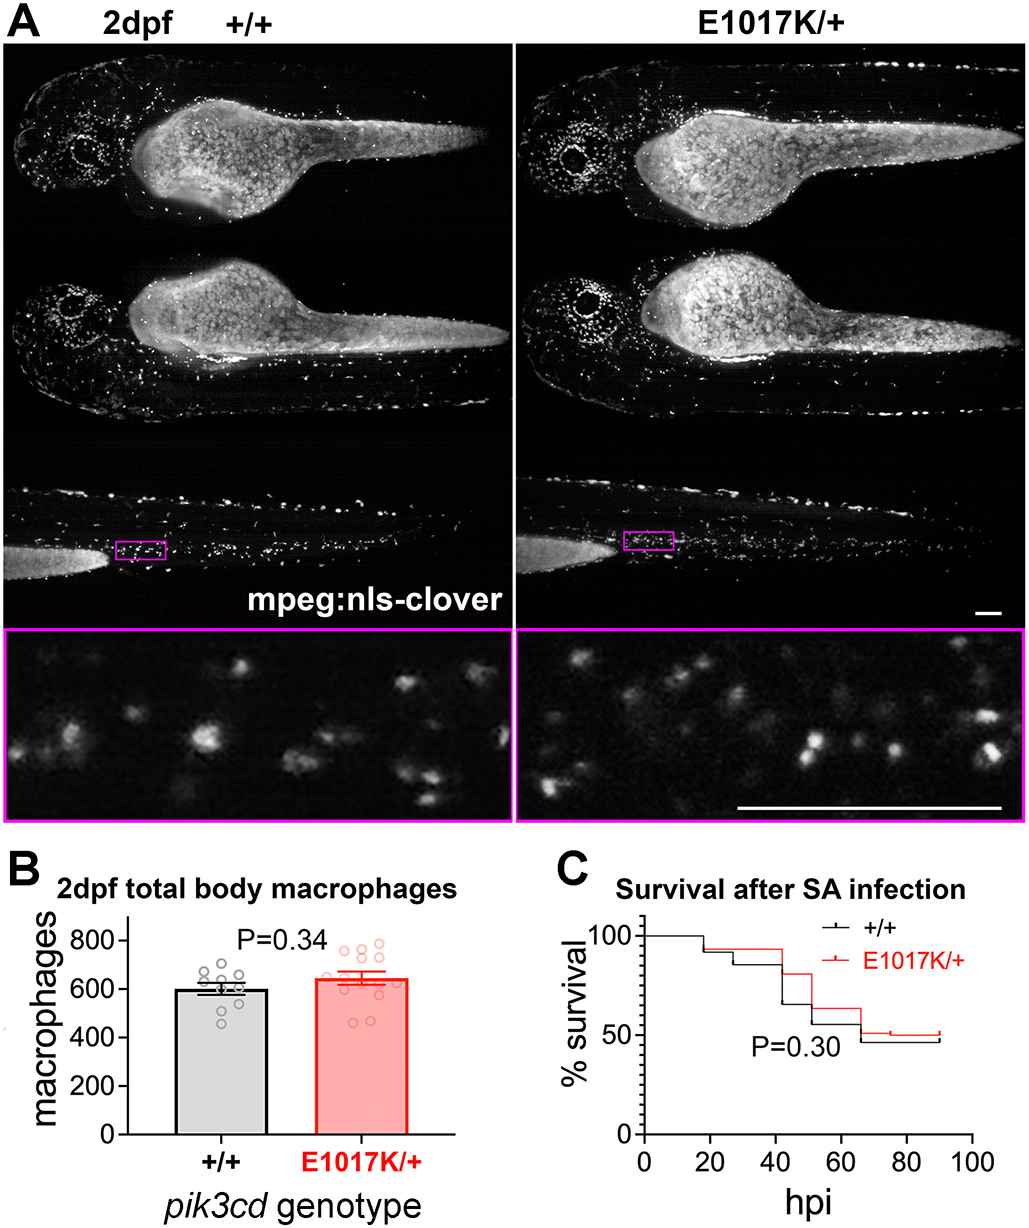
Total body macrophages in pik3cdE1017K/+ embryos and survival following S. aureus infection. (A) Light-sheet microscopy used to count total body Tg(mpeg1.1:NLS-clover)sh616 macrophages of pik3cdE1017K/+ and pik3cd+/+ 2 dpf, sibling embryos. Top three rows show maximal-intensity projections for the three views used for each embryo. The magenta border shows the region displayed in the bottom row as a single-slice view from the image stack at higher magnification as used for counting. Scale bars: 100µm. (B) Chart of total body macrophages counted from light-sheet microscopy views as in A for 24 sibling 2 dpf pik3cdE1017K/+and pik3cd+/+ embryos. Bars show the mean±s.e.m., Mann–Whitney test. Data shown are from one experiment. (C) Survival of 214 sibling pik3cdE1017K/+and pik3cd+/+ embryos following injection of 1500 colony-forming units of S. aureus (SA) into the circulation. Log-rank (Mantel–Cox) test. Data shown are from one experiment. A repeat experiment with 229 embryos showed similar results (P=0.99 between genotypes).