
|
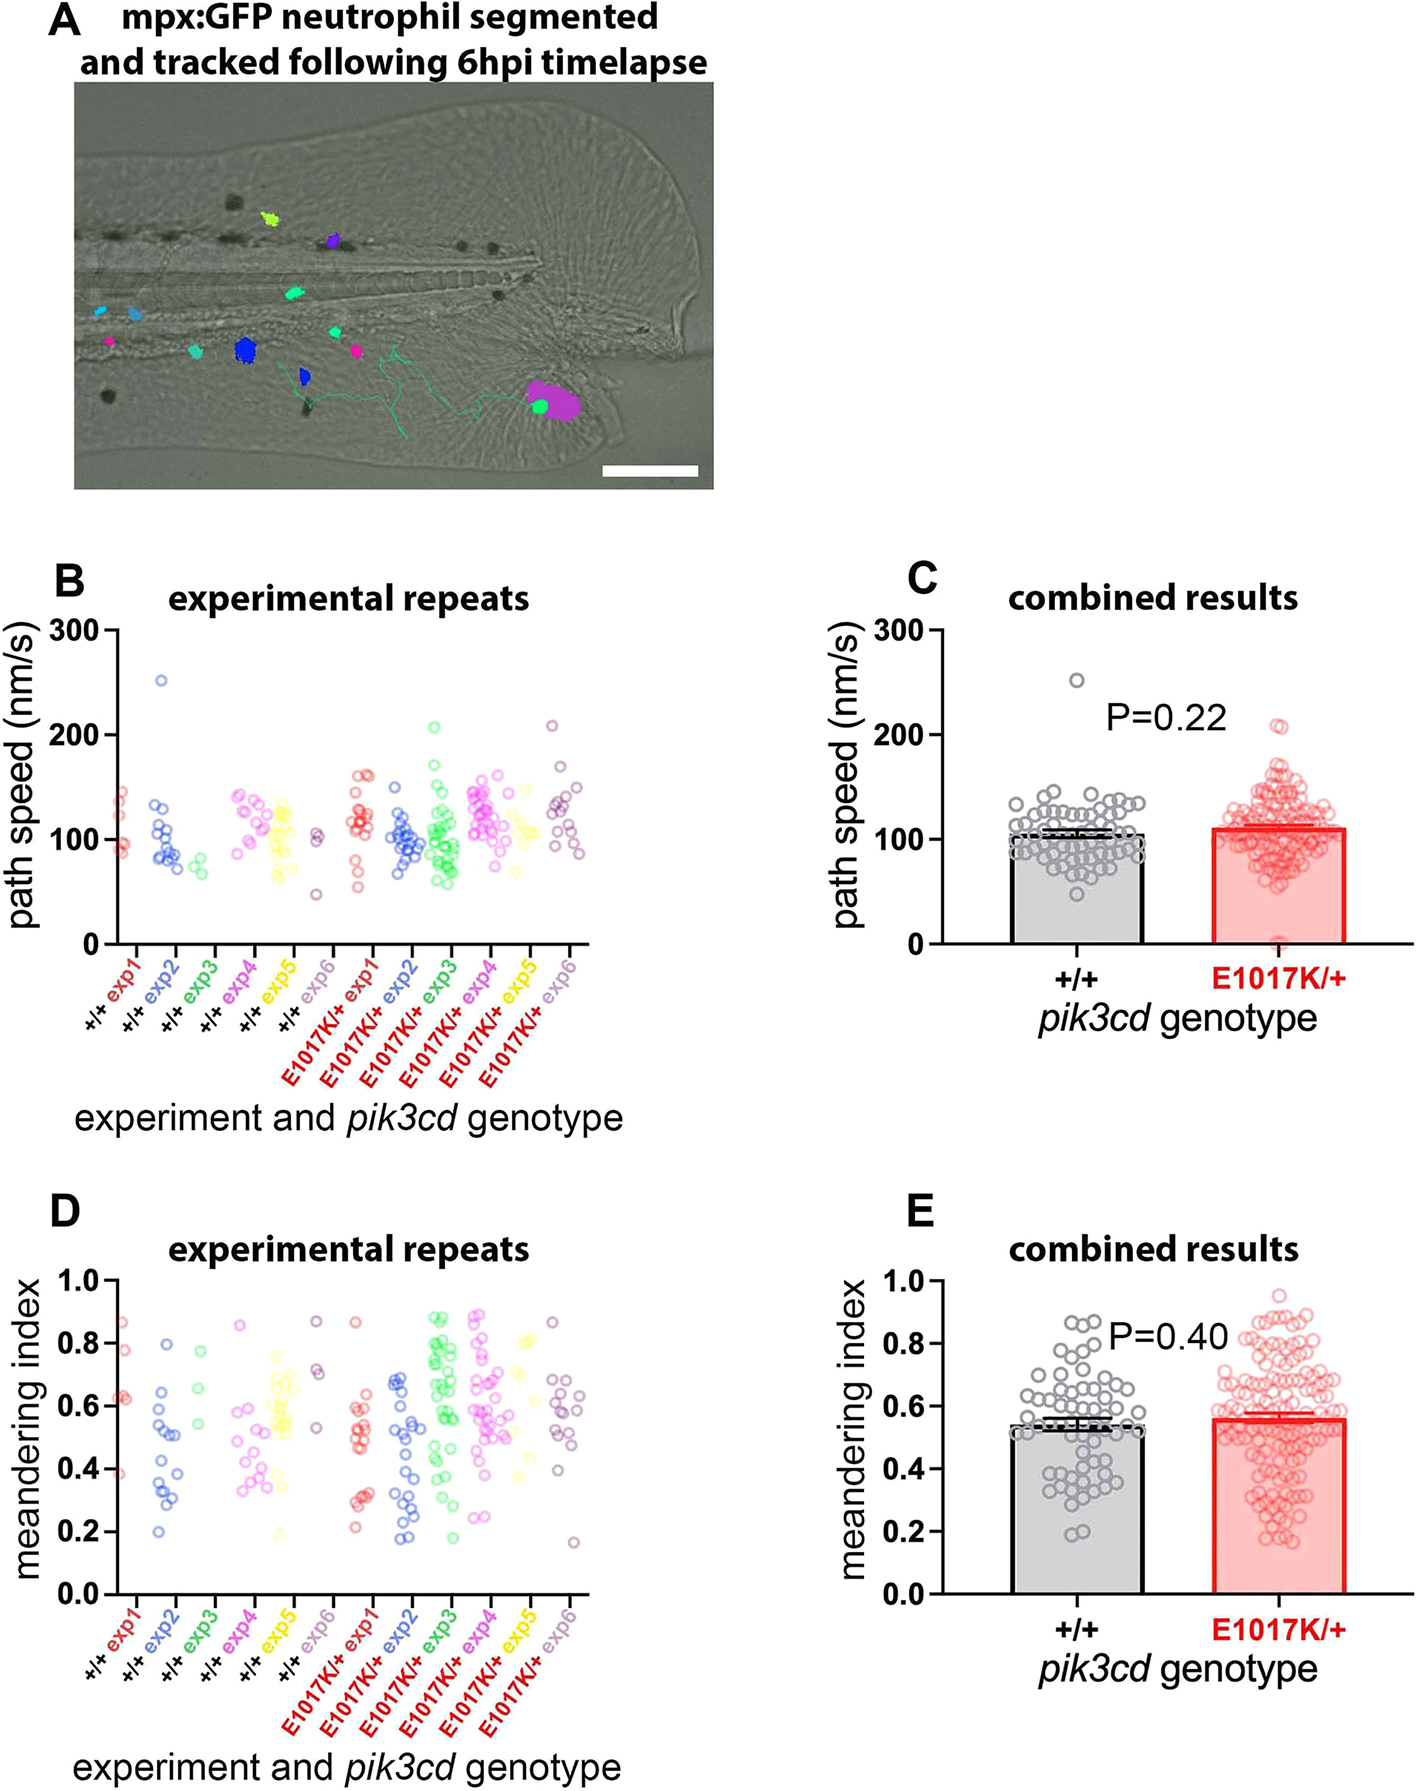
Fig. 8
Neutrophil migration in pik3cdE1017K/+ embryos. (A) Illustrative example of the TgBAC(mpx:gfp)i114 tail-fin injury inflammation model used to track neutrophil migration at 3 dpf. Following a minor tail-fin injury and widefield time-lapse microscopy for 6 hpi, semi-automated segmentation and tracking with NIS Elements software determined migration paths to the injury site. Segmented TgBAC(mpx:gfp)i114 neutrophils are shown as false-coloured patches, and a migration track is shown as a green line, superimposed on a brightfield micrograph (taken at the start of the time-lapse sequence). Scale bar: 100 µm. (B) Chart of path speeds for tracked neutrophils from sibling pik3cdE1017K/+ and pik3cd+/+ embryos as in A. Data are shown for each of six experiments, each with eight or nine embryos. (C) Chart of pooled data from B. Bars show the mean±s.e.m., unpaired t-test with Welch's correction. (D) Chart of meandering index (displacement/path length) for the tracked neutrophils as in B. (E) Chart of pooled data from D. Bars show the mean±s.e.m., unpaired t-test with Welch's correction.