
- Title
-
Neurodevelopmental toxicity of organophosphate flame retardant triphenyl phosphate (TPhP) on zebrafish (Danio rerio) at different life stages
- Authors
- Zhang, Q., Zheng, S., Shi, X., Luo, C., Huang, W., Lin, H., Peng, J., Tan, W., Wu, K.
- Source
- Full text @ Environ. Int.
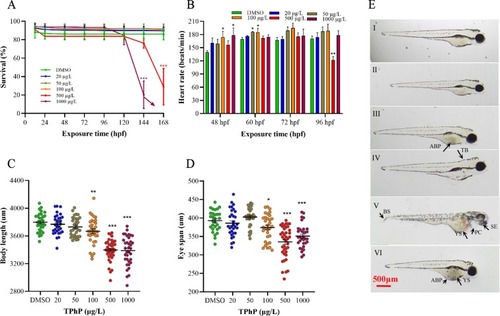
Fig. 1. TPhP induces developmental toxicity to embryonic zebrafish. (A) The survival rate of zebrafish larvae after 2–168 h of exposure. (B) zebrafish heart rate at 48–96 hpf. (C) Body length of the larvae at 96 hpf. (D) Eye span of the larvae at 96 hpf. (E) zebrafish malformation at 96 hpf after exposure to TPhP. Arrows in Fig. 1E: ABP, Abnormal body pigmentation; TB, tail bent; YS, yolk cyst; PC, pericardial cyst; SE, small eye. All the data are presented as mean ± SD. *p < 0.05, **p < 0.01, and ***p < 0.001, compared with the control. |
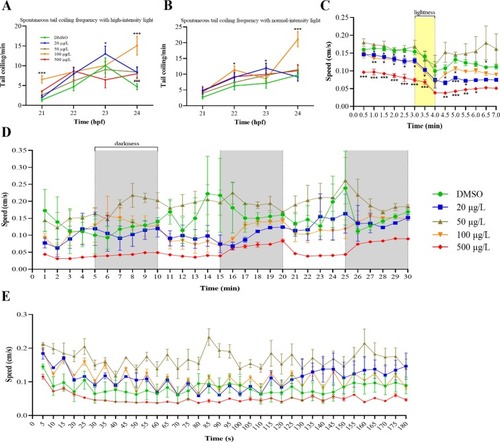
Fig. 2. TPhP exposure induced behavior changes of zebrafish larvae. Spontaneous movements (number of tail coiling per min) of zebrafish embryos under high (A) and normal (B) light intensity (2000/4400 Lux) at 21–24 hpf. Each treatment group consisted of 3 replicates and each replicate included 30 larvae. The velocity of zebrafish larvae following TPhP exposure was depicted by the panic and avoidance reflex for high-light stimulation (3-min dark, 1-min light and 3-min dark phases) (C), the alternating light/dark exploration model (5-min light and 5-min dark phases, repeated thrice) (D) and the light/dark flash model (5-s light and 5-s dark phases, eighteen cycles, total 180 s) (E) at 5 dpf. Each treatment group consisted of 3 replicates and each replicate included 32 larvae. All the data are presented as mean ± SD. *p < 0.05, **p < 0.01, and ***p < 0.001, compared with the control. ### p < 0.001 compared to control (2000 Lux) within the same concentration (A/B). |
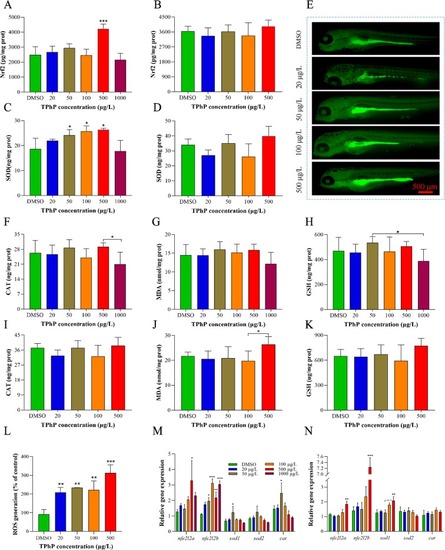
Fig. 3. TPhP affects the level/activity of Oxidative stress biomarkers. The levels of Nrf2 and SOD of zebrafish exposed to various concentrations of TPhP for 96 hpf (A/C) and 7 dpf (B/D). TPhP induced ROS production in zebrafish after 96 hpf was measured by incubation with DCFH-DA (E). The levels of CAT, MDA and GSH of zebrafish exposed to various concentrations of TPhP for 96 hpf (F-H) and 7 dpf (I-K). Quantitative analysis of ROS generation after TPhP exposure (L). The expression of oxidative stress-related genes in zebrafish after 96 hpf (M) and 7 dpf (N) exposure to TPhP. All the data are presented as mean ± SD. *p < 0.05, **p < 0.01, and ***p < 0.001, compared with the control. |
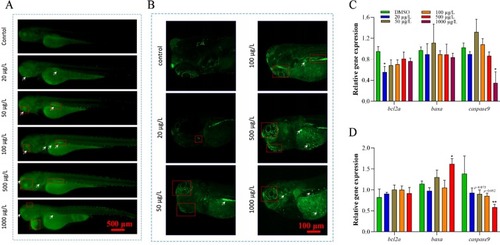
Fig. 4. Acridine orange (AO) staining and expression of genes related to apoptosis. (A) Representative fluorescent images of early apoptotic signals detected by AO staining in the DMSO and TPhP treated groups at 96 hpf. (B) Number of apoptotic cells in the head of zebrafish at 96 hpf observed with laser confocal microscopy. The expression of apoptosis-related genes in zebrafish after 96 hpf (C) and 7 dpf (D) exposure to TPhP. Data are presented as mean ± SD. *p < 0.05, **p < 0.01, and ***p < 0.001, compared with the control. (For interpretation of the references to colour in this figure legend, the reader is referred to the web version of this article.) |
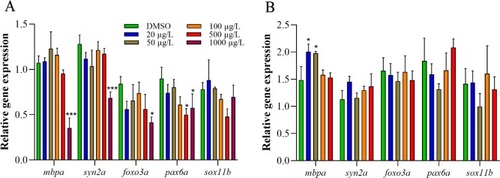
Fig. 5. TPhP-induced expression of neurodevelopment-related genes. The mRNA expression level of genes related to neurodevelopment in zebrafish at 96 hpf (A) and 7 dpf (B). All the data are presented as mean ± SD. *p < 0.05, **p < 0.01, and ***p < 0.001, compared with the control. |
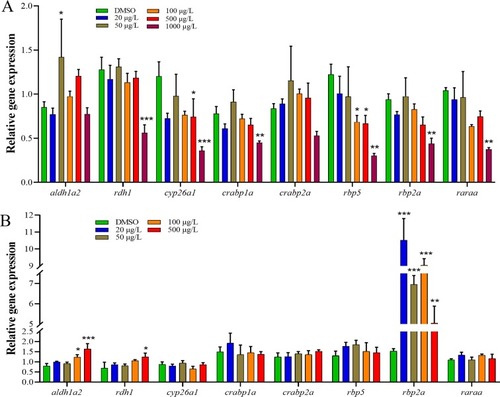
Fig. 6. TPhP-induced expression of retinoic acid metabolic-related genes. The expression level of genes related to retinoic acid metabolic in zebrafish at 96 hpf (A) and 7 dpf (B). All the data are presented as mean ± SD. *p < 0.05, **p < 0.01, and ***p < 0.001, compared with the control. |
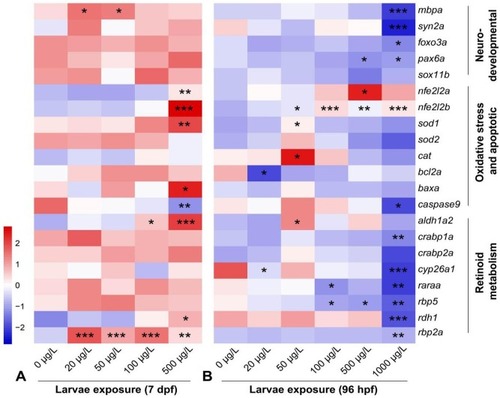
Fig. 7. The heatmap of all target gene expression in zebrafish larvae at 96 hpf (A) and 7 dpf (B) after exposure to TPhP. *p < 0.05, **p < 0.01, and ***p < 0.001, compared with the control. |
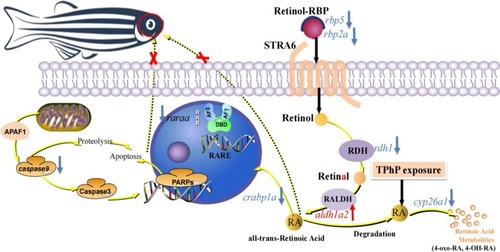
Fig. 8. The proposed retinoid metabolism and visual signaling of eye dysregulation and locomotor dysfunction in the zebrafish exposed to TPhP. |