
|
Fig. 3
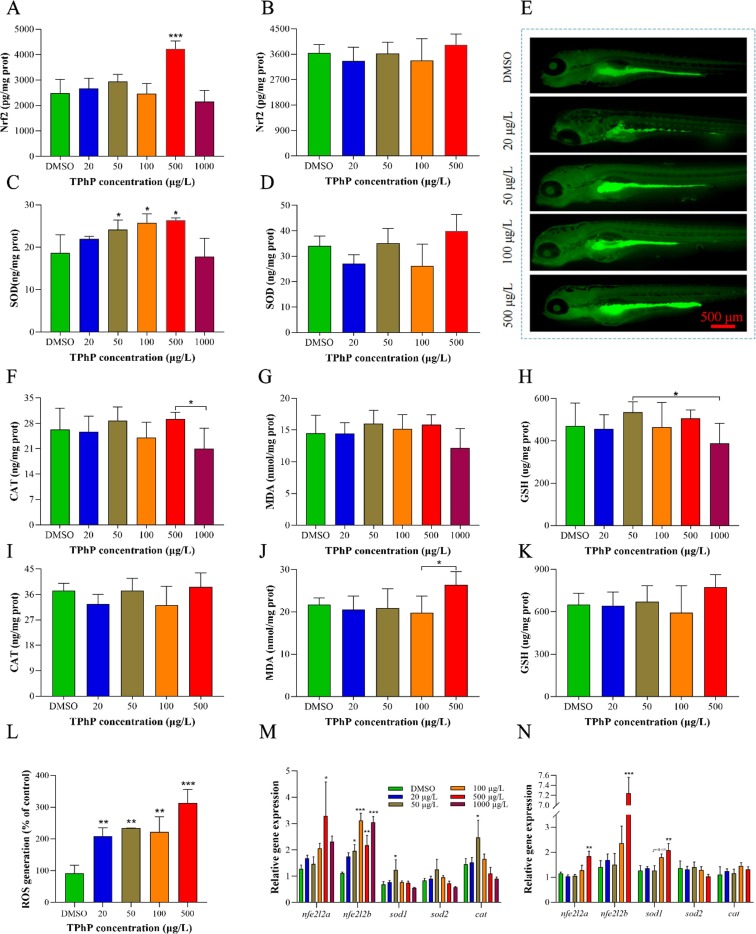
Fig. 3. TPhP affects the level/activity of Oxidative stress biomarkers. The levels of Nrf2 and SOD of zebrafish exposed to various concentrations of TPhP for 96 hpf (A/C) and 7 dpf (B/D). TPhP induced ROS production in zebrafish after 96 hpf was measured by incubation with DCFH-DA (E). The levels of CAT, MDA and GSH of zebrafish exposed to various concentrations of TPhP for 96 hpf (F-H) and 7 dpf (I-K). Quantitative analysis of ROS generation after TPhP exposure (L). The expression of oxidative stress-related genes in zebrafish after 96 hpf (M) and 7 dpf (N) exposure to TPhP. All the data are presented as mean ± SD. *p < 0.05, **p < 0.01, and ***p < 0.001, compared with the control.