
Image
|
Figure Caption
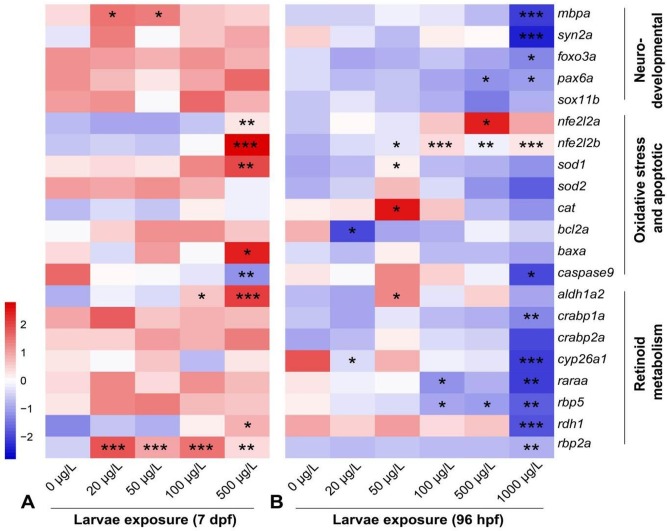
Fig. 7
Fig. 7. The heatmap of all target gene expression in zebrafish larvae at 96 hpf (A) and 7 dpf (B) after exposure to TPhP. *p < 0.05, **p < 0.01, and ***p < 0.001, compared with the control.
Acknowledgments
This image is the copyrighted work of the attributed author or publisher, and
ZFIN has permission only to display this image to its users.
Additional permissions should be obtained from the applicable author or publisher of the image.
Full text @ Environ. Int.