
- Title
-
Transfer of the zp3a gene results in changes in egg adhesiveness and buoyancy in transgenic zebrafish
- Authors
- Cao, Y.Q., Wang, Y.X., Zhao, Y., Zhang, J., He, X., Xie, P., Chen, J., Sun, Y.H.
- Source
- Full text @ Zool Res
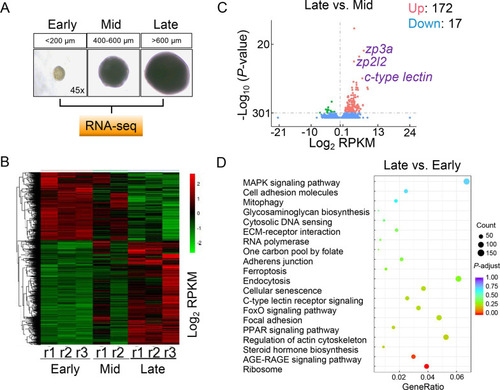
Identification of zp genes as candidates for regulation of egg adhesiveness A: Cartoon showing sampling and design of RNA-seq of rare minnow oocytes at different developmental stages. B: Heat map showing RNA-seq results for rare minnow oocytes at different stages. r1: repeat 1; r2: repeat 2; r3: repeat 3. Note: One sample from the mid group was removed due to poor quality. C: Volcano plot showing DEGs in rare minnow oocytes between mid and late stages. D: KEGG results showing enriched terms based on DEGs from C. |
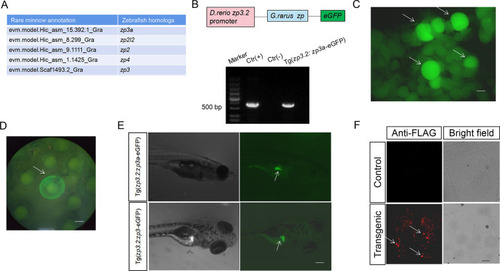
Establishment of transgenic zebrafish lines expressing rare minnow Zps A: Zp proteins identified in EE of rare minnow by LC-MS/MS. B: Upper: Cartoon showing zebrafish zp3.2 promoter-rare minnow zp-eGFP expression construct; Lower: Gel image showing GFP PCR products amplified from transgenic embryos. Ctr: zp3.2: eGFP constructs. C: Fluorescence image showing GFP signals in F0 transgenic ovaries. White arrows indicate oocytes with strong GFP signals. D: Image showing GFP expression in transgenic eggs from F0 parents. White arrow indicates ovulated egg with GFP signals on EE. E: Representative images showing GFP signals in the gonads of indicated transgenic lines. White arrows indicate GFP-positive gonads. F: IF images showing expression of FLAG-tagged Zp3a-eGFP protein in isolated EE of control and transgenic eggs using FLAG antibodies. Note: punctated signals were observed only on EE of transgenic eggs. Bar: 200 μm. |
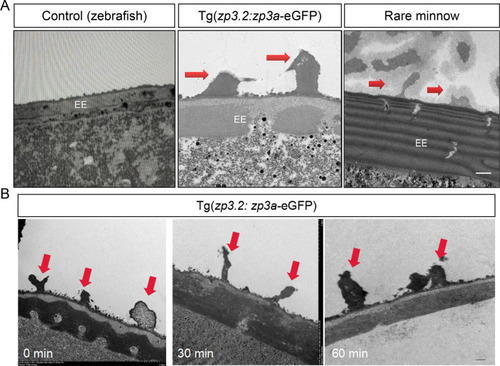
Gain of partial adhesiveness in transgenic zebrafish eggs A: TEM images showing structures in outer layer of 0 hpf fertilized eggs from WT zebrafish, Tg(zp3.2: zp3a-eGFP) line, and rare minnow. Red arrows indicate electron-dense projections. Bar: 2 μm. B: TEM images showing budlike structures on outer layer of transgenic eggs at indicated time points. Red arrows indicate electron-dense projections. Bar: 1 μm. |
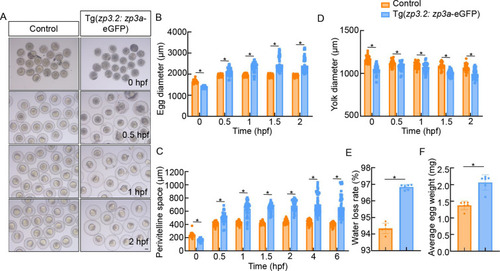
Enhanced hydration in transgenic zebrafish eggs A: Representative images showing morphology of fertilized control and transgenic eggs at indicated time points. Note: increased volume of transgenic eggs is compared to controls. B–D: Quantitation of egg, yolk, and perivitelline space diameter of control and transgenic eggs at indicated time points. E: Comparison of water loss between control and transgenic eggs at 1 hpf. F: Comparison of average weight of control and transgenic eggs at 1 hpf. Bar: 200 μm. *: P<0.05. |
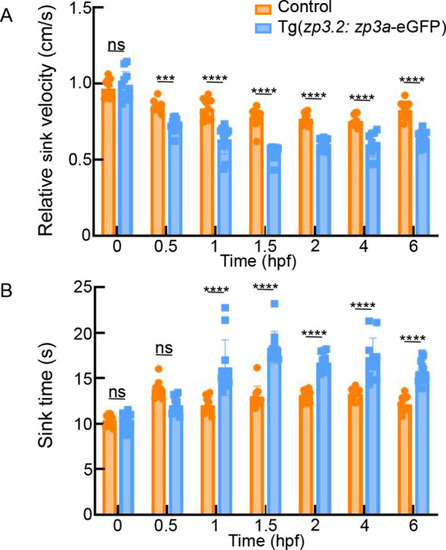
Gain of buoyancy in transgenic zebrafish eggs A: Bar graph showing relative sink velocity of transgenic and control eggs at the indicated time points. B: Bar graph showing time required to sink from the surface to the bottom of eggs at the indicated time points. Experiments were repeated three times. ns: Not significant; ***: P<0.001; ****: P<0.0001. |
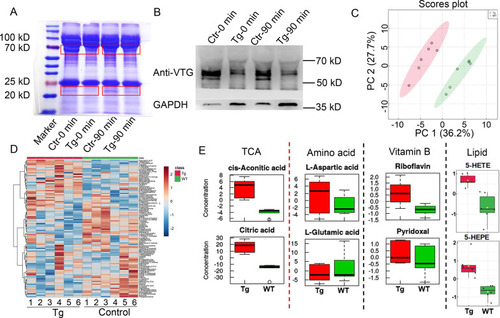
Changes in yolk cell metabolism in transgenic zebrafish eggs A: Coomassie brilliant blue-stained image showing a reduction in VTG levels in transgenic (TG) eggs compared to controls (Ctr) at indicated time points. Red boxes indicate where bands are obviously altered. B: Western blotting results showing greater reduction in VTG levels in transgenic eggs compared to controls at indicated time points. C: PCA showing clear separation between control and transgenic eggs. D: Heat map showing DMs between control (WT) and transgenic (TG) groups. Six control and transgenic eggs were sampled (numbered 1–6). E: Box plots showing relative concentration of indicated metabolites in indicated groups. |
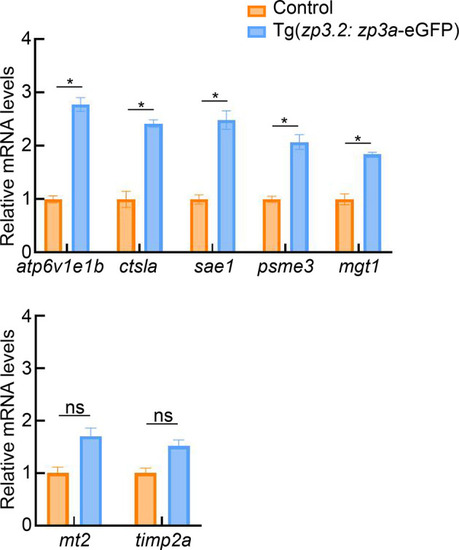
Expression of genes involved in VTG metabolism A, B: qRT-PCR results showing relative expression of indicated genes in control and transgenic eggs. Experiments were repeated three times. ns: not significant; *: P<0.05. |
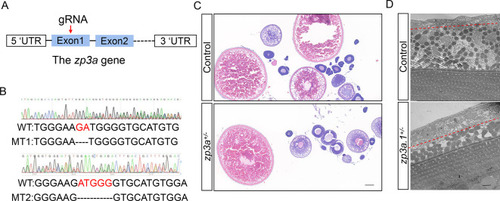
Generation of zp3a-deficient rare minnow A: Cartoon showing targeting site of sgRNA in zp3a gene of rare minnow. B: Genotyping results showing −2 bp mutant allele (up) and −5 bp mutant allele (bottom). C: H&E-stained images showing oocyte morphology in control and −5 bp heterozygous ovaries. Bar: 200 μm. D: Representative TEM images showing surface of EEs of control and heterozygous mutant oocytes. Red dashed lines indicate borders between developing adhesive layer and supporting somatic cells. Bar: 10 μm. |