
Image
|
Figure Caption
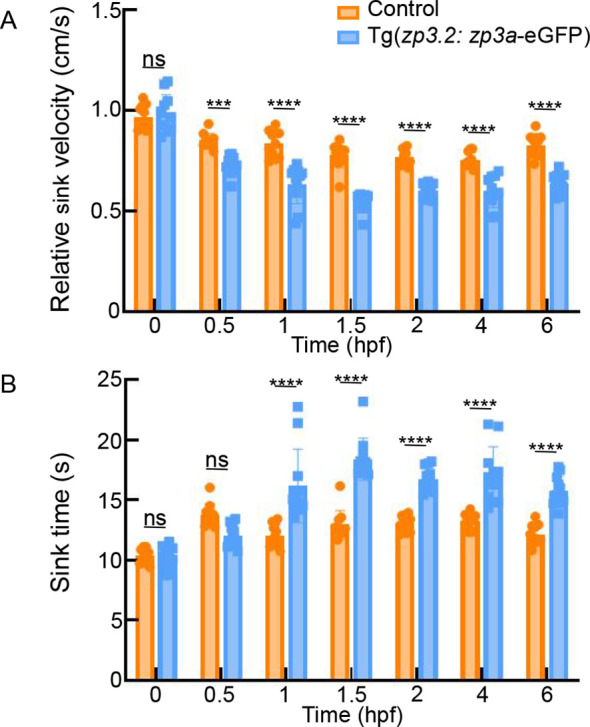
Fig. 5
Gain of buoyancy in transgenic zebrafish eggs
A: Bar graph showing relative sink velocity of transgenic and control eggs at the indicated time points. B: Bar graph showing time required to sink from the surface to the bottom of eggs at the indicated time points. Experiments were repeated three times. ns: Not significant; ***: P<0.001; ****: P<0.0001.
Acknowledgments
This image is the copyrighted work of the attributed author or publisher, and
ZFIN has permission only to display this image to its users.
Additional permissions should be obtained from the applicable author or publisher of the image.
Full text @ Zool Res