
Fig. 6
- ID
- ZDB-FIG-230626-21
- Publication
- Cao et al., 2023 - Transfer of the zp3a gene results in changes in egg adhesiveness and buoyancy in transgenic zebrafish
- Other Figures
- All Figure Page
- Back to All Figure Page
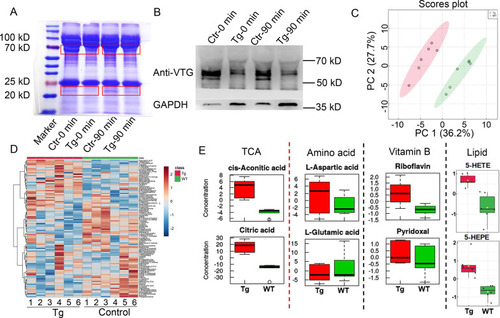
Changes in yolk cell metabolism in transgenic zebrafish eggs A: Coomassie brilliant blue-stained image showing a reduction in VTG levels in transgenic (TG) eggs compared to controls (Ctr) at indicated time points. Red boxes indicate where bands are obviously altered. B: Western blotting results showing greater reduction in VTG levels in transgenic eggs compared to controls at indicated time points. C: PCA showing clear separation between control and transgenic eggs. D: Heat map showing DMs between control (WT) and transgenic (TG) groups. Six control and transgenic eggs were sampled (numbered 1–6). E: Box plots showing relative concentration of indicated metabolites in indicated groups. |