
- Title
-
Characterization of the Secreted Acid Phosphatase SapS Reveals a Novel Virulence Factor of Staphylococcus aureus That Contributes to Survival and Virulence in Mice
- Authors
- Ahmad-Mansour, N., Elhawy, M.I., Huc-Brandt, S., Youssouf, N., Pätzold, L., Martin, M., Abdel-Wadood, N., Aljohmani, A., Morsli, M., Krasteva-Christ, G., Becker, S.L., Yildiz, D., Lavigne, J.P., Gannoun-Zaki, L., Bischoff, M., Molle, V.
- Source
- Full text @ Int. J. Mol. Sci.
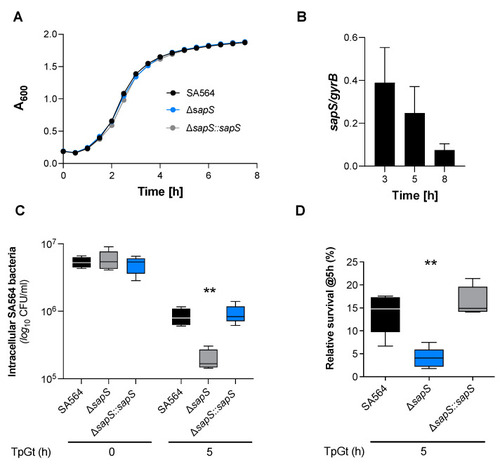
SapS has no impact on S. aureus SA564 growth in vitro but contributes to intramacrophage survival. (A) Growth kinetics of S. aureus strains SA564 (black symbols), SA564 ΔsapS (blue symbols), and SA564 ΔsapS::sapS (grey symbols) in TSB. Cells were cultured at 37 °C and 150 rpm in 96-well plates using a Spark 20M (Tecan, Trading AG, Männedorf, Switzerland) microplate reader. Data represent the mean A600 readings ± SD at the time points indicated (n = 3; error bars are too small to be visible). (B) Transcription of sapS during growth in TSB. Cells of SA564 were cultured at 37 °C and 225 rpm in a culture to flask volume of 1:10, and after 3 h, 5 h, and 8 h of growth, cells were harvested, total RNAs isolated, and qRT-PCRs performed for sapS. Transcripts were quantified in reference to gyrase B mRNA. Data are presented as mean + SD of five biological replicates. (C,D) Survival of S. aureus strain derivatives in infected RAW 264.7 macrophages. CFU rates recovered from infected cells lysates at the time points indicated. Data are presented as mean + SD (n = 5 biological replicates) (C) and survival rates expressed in relationship to the intracellular bacterial cell counts that were detected immediately after the gentamicin/lysostaphin treatment (T0), which was set to 100%. The data are displayed as box and whisker plots, displaying the median (horizontal line), interquartile range (25–75% box), and standard deviation (bars) of five different experiments (D). **, p < 0.01 (Kruskal–Wallis test followed by Dunn’s post-hoc test). TpGt, time post gentamicin treatment. |
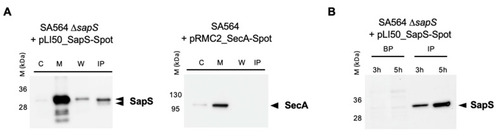
SapS is produced by S. aureus both in vitro and in infected macrophages. (A) Cultures were grown up to exponential phase and supernatants from SA564 ∆sapS + pLI50_SapS-Spot and SA564 + pLI50_SecA-Spot (negative secretion control) were filtered and immunoprecipitated using anti-Spot magnetic beads, while bacterial pellets were resuspended and lysed in PBS with lysostaphin, a protease inhibitor cocktail, DNAase I and fractionated. Cytoplasm (C), membrane (M), cell wall (W), and immunoprecipitated proteins (IP) from supernatants were migrated on SDS-PAGEs, transferred to PVDF membranes for Western-blot analyses using monoclonal mouse anti-Spot antibody as primary antibody (Chromotek, Germany) and an HRP-coupled donkey-anti-mouse antibody as secondary antibody (Jackson Immuno Research). Data are representative of three different experiments. (B) RAW 264.7 macrophages (2.5 × 10⁵ cells/well) were infected with S. aureus at a MOI of 20, and non-phagocytosed bacteria were subsequently removed by gentamicin/lysostaphin treatment. Infected macrophages were lysed in 0.1% Triton X-100 and centrifuged at 14,000× g. The macrophage lysates were immunoprecipitated with anti-Spot magnetic beads (Chromotek), while the pellets of the intracellular bacteria were resuspended in an equal volume of lysis buffer. Immunoprecipitated proteins (IP) and bacterial pellets (BP) were separated on SDS-PAGE and observed with an anti-Spot antibody as described in (A). Data are representative of three different experiments (M kDa: molecular markers). |

Infected zebrafish embryos display an increased level of survival when infected with the SA564 ΔsapS mutant. Kaplan–Meier graphic represents the survival of infected zebrafish embryos after injection in the duct of Cuvier with SA564 (black symbols), SA564 ΔsapS (blue symbols), and SA564 ΔsapS::sapS (grey symbols) strains at 3 × 10² CFU/nL grown in exponential phase, or PBS (negative control) The proportion of surviving embryos (n = 50 for each, indicative of three different experiments) is represented. **, p < 0.01, ns, not significant (Log-rank Mantel–Cox statistical test). hpi, hours post-infection. PHENOTYPE:
|
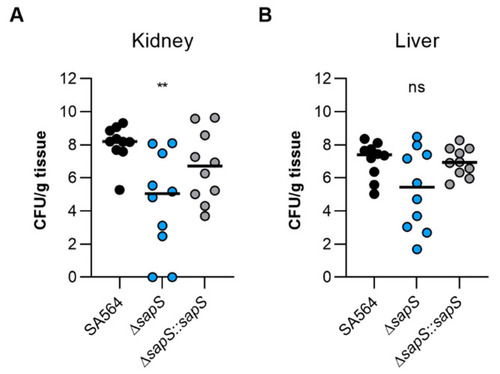
The virulence of S. aureus SA564 in a murine abscess model is enhanced by the presence of SapS. C57BL/6N mice were infected via retroorbital injection with 1 x 10⁷ cells of S. aureus strain SA564 (black symbols), SA564 ΔsapS (blue symbols), and the cis-complemented derivative SA564 ΔsapS::sapS (grey symbols), respectively (n = 10 per group). Mice were euthanised and to evaluate the bacterial burdens in the kidney (A) and liver (B) organs, livers and kidneys were excised and homogenised in PBS 4 days after infection. Serial dilutions of the homogenates were then plated on sheep blood agar plates. One mouse is represented by each symbol. The median of all observations is indicated by the horizontal bars. ns, not significant; ** p < 0.01 (Kruskal–Wallis test followed by Dunn’s post hoc test). Only differences that are statistically significant between WT and mutants are displayed. |
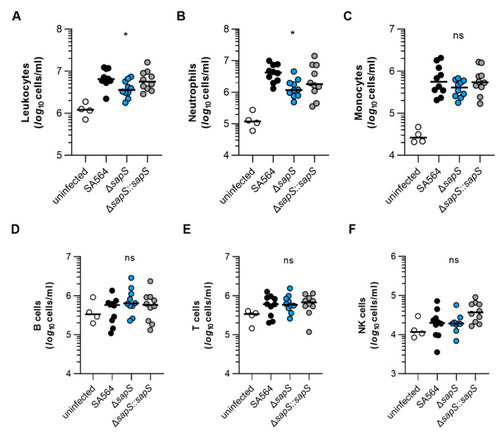
The impact of SapS on the immune cell composition observed in the blood of mice infected with S. aureus. C57BL/6N mice were infected with S. aureus strain SA564 (black symbols), SA564 ΔsapS (blue symbols), and the cis-complemented derivative SA564 ΔsapS::sapS (grey symbols), respectively (n = 10 per group). After 4 days of infection, blood was withdrawn from narcotized mice, red blood cells lysed, the residual blood cells stained with fluorochrome-conjugated antibodies and the cell contents of leukocytes (A), neutrophils (B), monocytes (C), B cells (D), T cells (E), and NK cells (F) determined by flow cytometry. Blood from age-matched uninfected mice served as control (white symbols). Each symbol represents the cell content obtained from the blood of an individual mouse. The median of all the observations is shown by the horizontal bar. ns, not significant; * p < 0.05 (Kruskal–Wallis test followed by Dunn’s post hoc test. Only significant differences between WT-infected and mutant-infected mice are shown). |

MPO, KC, and TNF-α contents in kidney tissues obtained from mice at day 4 post infection. C57BL/6N mice were infected with S. aureus strain SA564 (black symbols), SA564 ΔsapS (blue symbols), and the cis-complemented derivative SA564 ΔsapS::sapS (grey symbols), respectively (n = 10 per group). Four days after infection, mice were euthanised, kidneys were extracted and blended with PBS solution, the tissue homogenates centrifuged, and the MPO (A), KC (B), and TNF-α (C) contents in the supernatants determined by enzyme-linked immunosorbent assays. Kidney homogenates from age-matched uninfected mice served as control (white symbols). Each symbol represents the amount of enzyme/cytokine found in the kidney homogenate of an individual mouse. The median of all the observations is shown by the horizontal bar. ns, not significant; * p < 0.05; **, p < 0.01 (Kruskal–Wallis test followed by Dunn’s post hoc test. Only significant differences between WT-infected and mutant-infected mice are shown). |
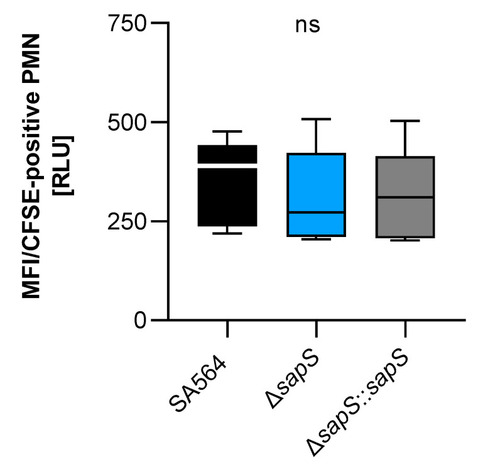
Impact of SapS on the phagocytosis of S.aureus strain SA564 by polymorphonuclear leukocytes (PMNs). The cells of S. aureus were labeled with carboxyfluorescein diacetate succinimidyl ester (CFSE) and mixed to lithium heparin-anticoagulated fresh human blood at a multiplicity of infection of 50 per PMN, and maintained at 37 °C and 1000 rpm. Using flow cytometry, as described in the Material and Methods section, the adhesion and ingestion of bacteria by PMNs was examined. The data show three biological replicates that were performed in triplicate. Data are presented as box and whisker plots showing the interquartile range (25–75%; box), median (horizontal line), and whiskers (bars; min/max). ns, not significant (Kruskal–Wallis test followed by Dunn’s post hoc test). |
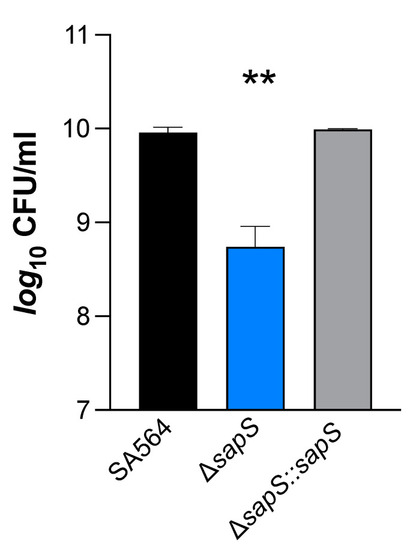
Impact of H2O2 on S. aureus SA564 ΔsapS survival. Cells of S. aureus SA564 (black), SA564 ΔsapS (blue), and SA564 ΔsapS::sapS (grey) were grown in TSB at 37 °C and 225 rpm for 2 h, then were challenged with 50 mM H2O2, and the CFU counts of the cultures were evaluated at 1 h after the H2O2 challenge. The data displayed are the mean + SD of four biological experiments. **, p < 0.01 (Ordinary One-Way ANOVA test). |

The effect of deleting the sapS gene in S. aureus on the transcription of genes that code for enzymes involved in the detoxification of reactive oxygen species (ROS). qRT-PCR was used to conduct quantitative transcript analyses of ahpC (A), katA (B), crtM (C), sodA (D) and sodM (E) in SA564 (black bars) and SA564 ΔsapS (blue bars) cells cultured in TSB at 37 °C and 225 rpm at the time points indicated. Quantification of the transcripts was performed in relation to the transcription of gyrase B (in copies per copy of gyrB). The data are shown as mean + SD of five biological replicates. ns, not significant; * p < 0.05 (Mann-Whitney U test between WT and mutant at a given time point). |

Impact of a sapS deletion on S. aureus SA564 ability to produce biofilms. (A) Cells of S. aureus SA564 (black), SA564 ΔsapS (blue), and SA564 ΔsapS::sapS (grey) were cultivated in BHI for 48 h at 37 °C in a humid atmosphere using 96-well microtiter plates. The crystal violet assay was used to evaluate the entire biofilm formation. The optical density (550 nm) and the production of biofilm are directly correlated. The presentation includes the means as well as the standard errors for a total of six different replicates. (B–D) Influence of SapS on the ability of S. aureus SA564 to build biofilms on medical devices. (B) Photographs of fragments of S. aureus-loaded peripheral venous catheters (PVC) taken on day 5 after the initial inoculation (6.3-fold magnification). These findings are indicative of three separate tests. An uninfected PVC fragment incubated for 5 days in sterile medium served as control. (C,D) Total biomass and CFU rates of detached biofilms were calculated by measuring the OD600 of the TSB solutions (B) and plate counting (D). The values of each individual experiment are represented by symbols, along with the median value (horizontal line) (n = 8). *, p < 0.05; ns, not significant (Kruskal–Wallis test and Dunn’s post hoc test, only the changes between SA564 and mutants are displayed). |

SapS phosphatase activity depends on the D103 residue and is neither implicated in the intramacrophage survival potential nor infectivity of S. aureus in zebrafish. (A) Cells of S. aureus SA564 (black), SA564 ΔsapS (blue), SA564 ΔsapS + pLI50_SapS-Spot (dark grey) and SA564 ΔsapS + pLI50_SapS_D103A-Spot (light grey) were grown in TSB at 37 °C until exponential phase, centrifuged, lysed and total crude extracts were used for phosphatase activity assays on PNPP. Data are presented as mean + SD of three biological replicates. **, p < 0.01; *** (Mann–Whitney U test). (B) Survival of S. aureus in infected macrophages. Survival rates are expressed as a percentage of the intracellular bacterial cell counts that were obtained immediately after the gentamicin/lysostaphin treatment, which was fixed to 100%. The data are presented as box and whisker plot showing the interquartile range (25–75%, box), the median (horizontal line) and the standard deviation (bars) of 4 different experiments. **, p < 0.01 (Ordinary two-way ANOVA test). (C) Kaplan–Meier representation of the survival of zebrafish embryos infected by injection into the duct of Cuvier with at 3 × 10² CFU/nL cultured in exponential phase, or PBS (negative control) The proportion of surviving embryos (n = 50 for each, indicative of three separate experiments) is employed to express the results. **, p < 0.01, ns, not significant (Log-rank Mantel–Cox statistical test). hpi, hours post-infection. |