
|
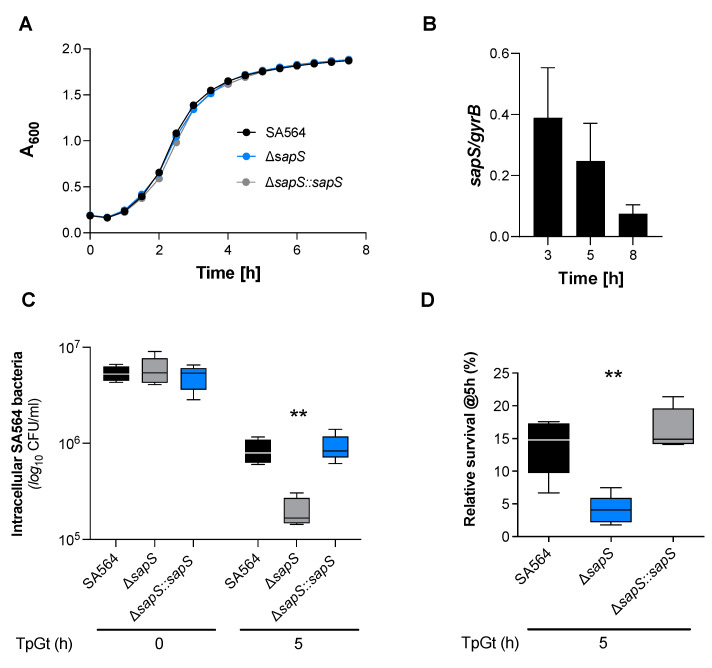
Figure 1
SapS has no impact on S. aureus SA564 growth in vitro but contributes to intramacrophage survival. (A) Growth kinetics of S. aureus strains SA564 (black symbols), SA564 ΔsapS (blue symbols), and SA564 ΔsapS::sapS (grey symbols) in TSB. Cells were cultured at 37 °C and 150 rpm in 96-well plates using a Spark 20M (Tecan, Trading AG, Männedorf, Switzerland) microplate reader. Data represent the mean A600 readings ± SD at the time points indicated (n = 3; error bars are too small to be visible). (B) Transcription of sapS during growth in TSB. Cells of SA564 were cultured at 37 °C and 225 rpm in a culture to flask volume of 1:10, and after 3 h, 5 h, and 8 h of growth, cells were harvested, total RNAs isolated, and qRT-PCRs performed for sapS. Transcripts were quantified in reference to gyrase B mRNA. Data are presented as mean + SD of five biological replicates. (C,D) Survival of S. aureus strain derivatives in infected RAW 264.7 macrophages. CFU rates recovered from infected cells lysates at the time points indicated. Data are presented as mean + SD (n = 5 biological replicates) (C) and survival rates expressed in relationship to the intracellular bacterial cell counts that were detected immediately after the gentamicin/lysostaphin treatment (T0), which was set to 100%. The data are displayed as box and whisker plots, displaying the median (horizontal line), interquartile range (25–75% box), and standard deviation (bars) of five different experiments (D). **, p < 0.01 (Kruskal–Wallis test followed by Dunn’s post-hoc test). TpGt, time post gentamicin treatment.